and the distribution of digital products.
State of Bitcoin Q1 2025
- Despite setting a new all-time high in January, BTC ended Q1 down 12% QoQ at $82,500. Risk-off sentiment from U.S. tariffs on Canada and Mexico weighed on price, although the launch of the Strategic Bitcoin Reserve (SBR) in March helped support BTC during the latter half of the quarter.
- Spot Bitcoin ETFs continued to accumulate BTC despite price headwinds. AUM in BTC rose 3% QoQ to 1.19 million BTC, while AUM in USD declined 9% due to the market correction. IBIT and FBTC expanded their holdings, while GBTC saw slower outflows than previous quarters.
- Onchain activity declined, with average daily transactions down 28% QoQ, and metaprotocol activity shifting. Despite the overall decrease in transactions, BRC-20 transactions surged 157% QoQ amid lower fees, surpassing runes transactions for the first time.
- Network fees dropped 64% QoQ in BTC terms, reaching the lowest levels since the inscription boom in Q4’23. Meanwhile, miner revenue increased 7% QoQ to $42.9 million daily despite falling fees.
- Bitcoin’s ecosystem continues to expand with new Bitcoin layers and staking protocols. While DeFi TVL in USD terms declined 17% QoQ, BTC-denominated metrics remained more stable. Berachain, Base, and Stacks saw notable growth in bridged BTC, while Babylon maintained dominance in Bitcoin DeFi with an 82% TVL share.
Bitcoin (BTC) is the first distributed consensus-based, peer-to-peer payment settlement network. Bitcoin (BTC), the native asset of the Bitcoin blockchain, was the world's first digital currency without a central bank or administrator. Often referred to as digital gold, bitcoin has a predictable, stable monetary policy that operates autonomously, giving it the ideal store-of-value properties.
To secure its network, Bitcoin uses a Proof-of-Work (PoW) consensus mechanism to solve the “double-spend problem.” PoW requires participants (miners) to contribute computing power to solve arbitrary mathematical puzzles in order to add a new block to the blockchain. Bitcoin is awarded to the miner who solves the puzzle first, thus minting new bitcoins.
Bitcoin has historically been focused on enabling peer-to-peer payments and being a store of value, but not as much on DeFi, NFTs, and other narratives enabled by programmability (i.e., expressive smart contracts and arbitrary computation). Instead, those narratives were deferred to alternative networks. However, Bitcoin is now experiencing a renaissance of programmability, largely thanks to two recent innovations, Ordinal Theory and BitVM. Both innovations leverage offchain indexing or computation, and neither makes any changes to the core protocol. Ordinal Theory emphasized the demand for added functionality, and then BitVM made expressive and trust-minimized L2s seem possible. These innovations have sparked a frenzy of experimentation with onchain assets and modular layers.
Whitepaper / Reddit / GitHub
Key Metrics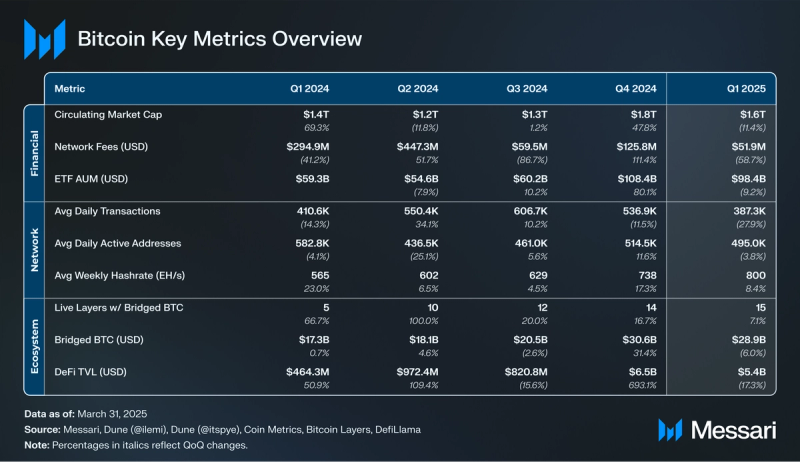 Financial Overview
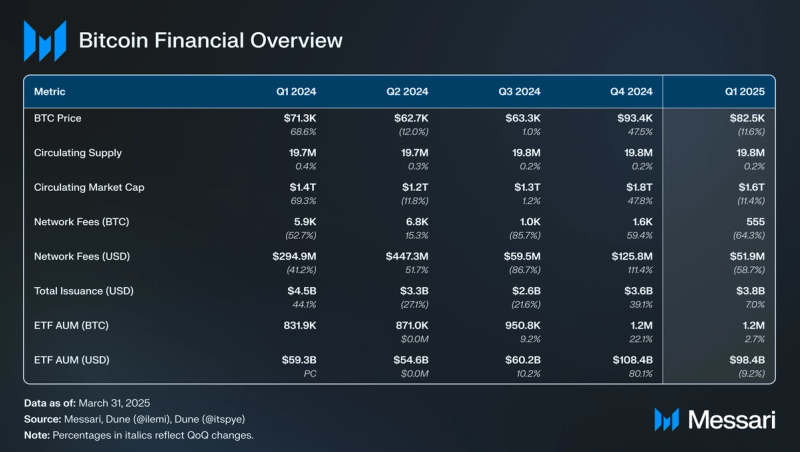 Market Cap and ETFs
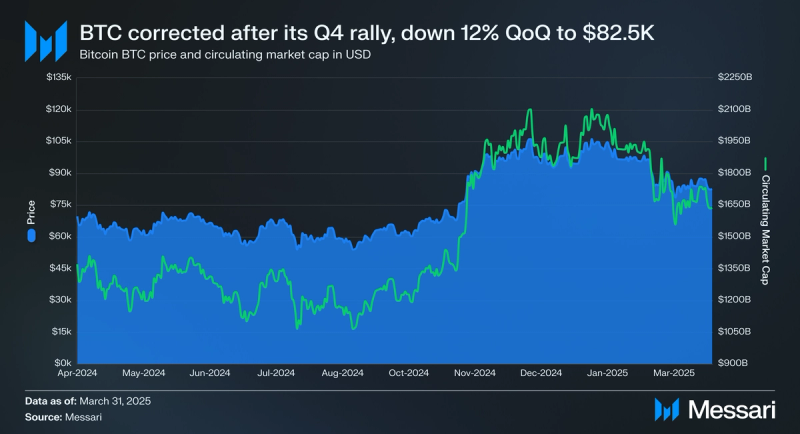
After one of BTC’s most bullish quarters ever in Q4’24, BTC experienced a slight correction in Q1’25. Despite a new all-time high in January ($109,400 on Jan. 20), BTC ended the quarter at $82,500, down 12% QoQ from $93,400 in Q4. BTC broke below its $90,000 range at the end of February as U.S. President Donald Trump placed tariffs on Canada and Mexico. Notably, however, the adverse effects of tariffs were not exclusive to BTC, as other risk assets such as U.S. equities experienced bearish price action during the same time period. One boon to BTC’s price action in Q1 was the establishment of the Strategic Bitcoin Reserve (SBR) on March 6. This executive order mandates the U.S. government to hold and manage seized Bitcoin assets as a reserve asset. Additionally, it opens the door for future budget-neutral acquisitions of BTC. The SBR potentially helped limit BTC’s downside in March amidst a broader risk-off environment. Strategy (formerly MicroStrategy) continued buying BTC in Q1. It increased its holdings of BTC from 446,400 at the end of Q4 to 528,200 at the end of Q1 (up 18% QoQ).
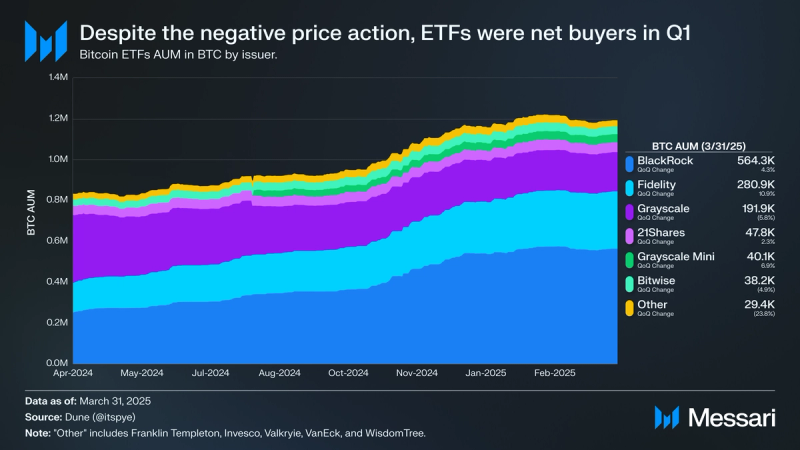
Despite the price decrease, spot Bitcoin ETFs continued accumulating in Q1. Spot Bitcoin ETF AUM in BTC increased 3% QoQ from 1.16 million to 1.19 million BTC. As for AUM in USD, it decreased by 9% QoQ from $108.43 billion to $98.44 billion. Nearly half of all the AUM (47%) is held by Blackrock’s IBIT, which is the most successful ETF launch in history. IBIT’s BTC holdings increased 4% QoQ to 564,300. The second largest ETF, Fidelity’s FBTC, increased its BTC holdings by 11% QoQ to 280,900, representing 24% of all AUM (up 8% QoQ from 22%). BTC in Grayscale’s GBTC decreased to 191,900, down 69% from 617,400 at launch. However, the outflows from GBTC continued to decelerate in Q1 as its BTC holdings fell 6%, compared to -7% in Q4. Combined, IBIT, FBTC, and GBTC hold 87% of all BTC in spot Bitcoin ETFs (up 1% QoQ from 86%).
Supply Dynamics and Fees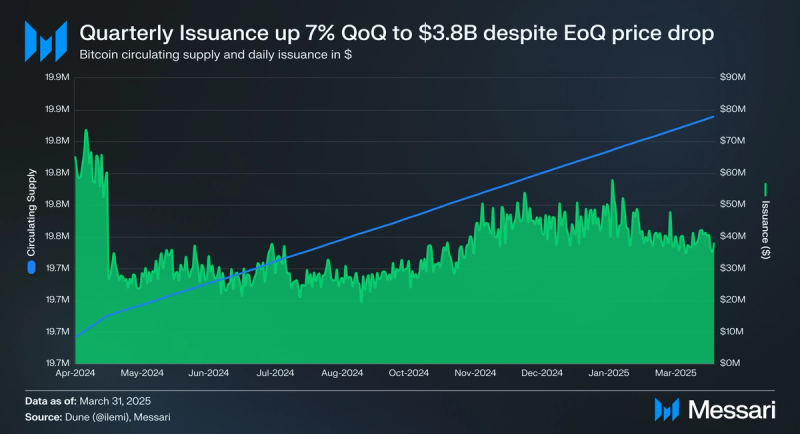
Bitcoin’s circulating supply increased by 0.2% QoQ from 19.80 million to 19.84 million in Q1. Until Bitcoin’s next halving in 2028, block rewards per mined block are 3.125 BTC. Total issuance in USD was up 7% QoQ from $3.56 billion to $3.81 billion, despite BTC finishing Q1 at a lower price than Q4. Taking a look at daily average issuance by month, issuance remained quite steady throughout the quarter, but ultimately trended downwards:
- January - $44.7 million
- February - $43.5 million
- March - $38.9 million
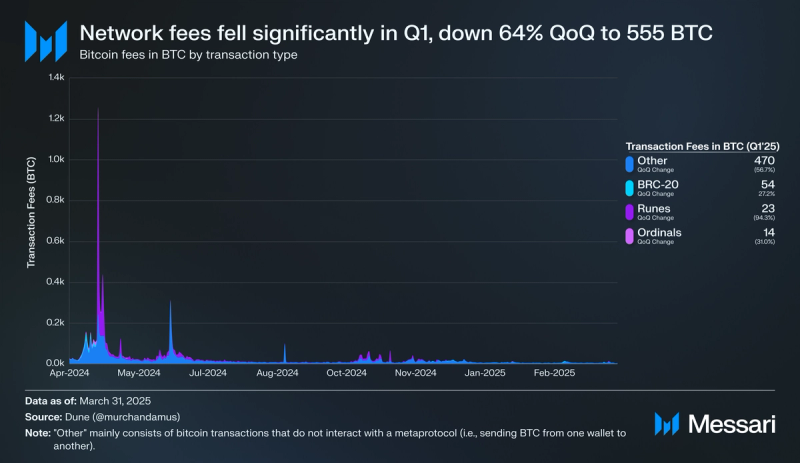
Network fees fell sharply in Q1 after rebounding in Q4. In BTC, fees decreased 64% QoQ from 1,600 to 555. In USD terms, the decrease was slightly better as it was down 59% QoQ from $125.8 million to $51.9 million. This decrease is concerning as it was the lowest quarter for network fees since metaprotocols like Ordinals and Runes first became popular in Q4’23. Compared to other L1s, Solana ($369.5 million), Ethereum ($210.4 million) TRON ($162.6 million), Hyperliquid ($136.5 million), and BNB Smart Chain ($70.5 million) had more network fees in Q1. Notably, last quarter, Bitcoin had more network fees than BNB Smart Chain and Hyperliquid.
Broken down by transaction type, the majority of network fees still come from “regular” transactions (i.e., sending BTC from one wallet to another). 84% of all transaction fees came from “regular” transactions, up 20% QoQ from 70% in Q4. Metaprotocols for fungible tokens, Runes and BRC-20 saw a decreasing share of fees in Q1. Runes accounted for 23 BTC in fees (down 94% QoQ from 405 BTC), while BRC-20 accounted for 54 BTC in fees (up 10% QoQ from 42 BTC). Notably, this was the first quarter BRC-20 surpassed Runes in fees since Runes launched in Q2’24. Combined, runes and BRC-20 were 29% of network fees in Q4, down 52% QoQ from 29%. Lastly, network fees from non-fungible ordinals fell 31% QoQ from 20 to 14 BTC.
Network Overview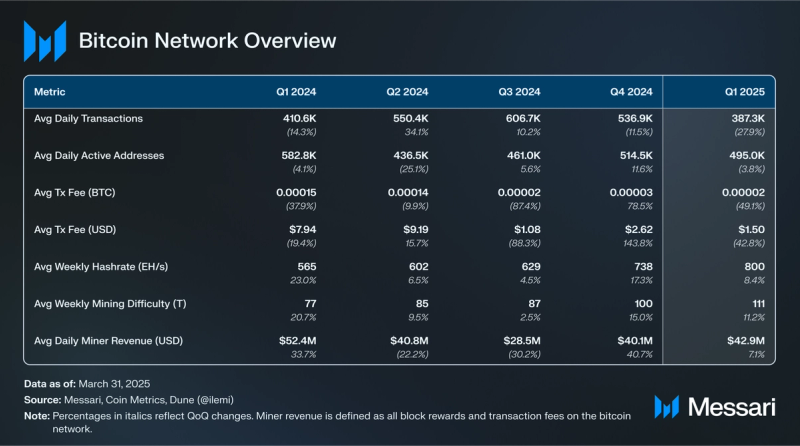 Onchain Activity
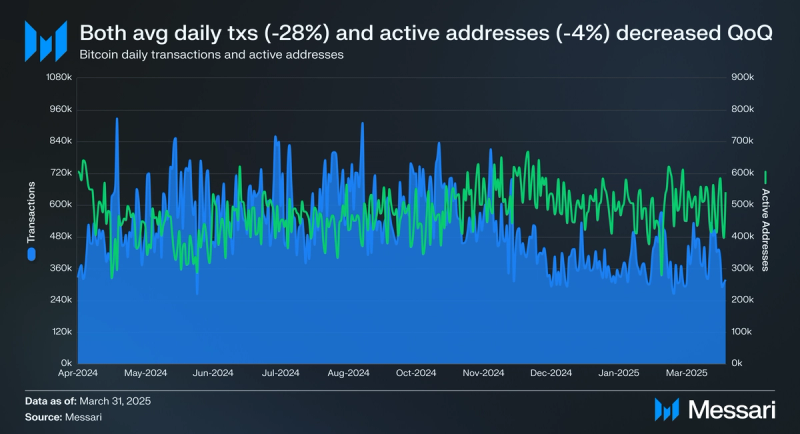
Onchain activity trended lower in Q1. Average daily transactions were down 28% QoQ from 536,900 to 387,300, while average daily active addresses fell slightly by 4% QoQ from 514,500 to 495,000. Average daily active addresses have remained steady over the past 4 quarters, as they have been consistently within the range of 400,000 to 600,000.
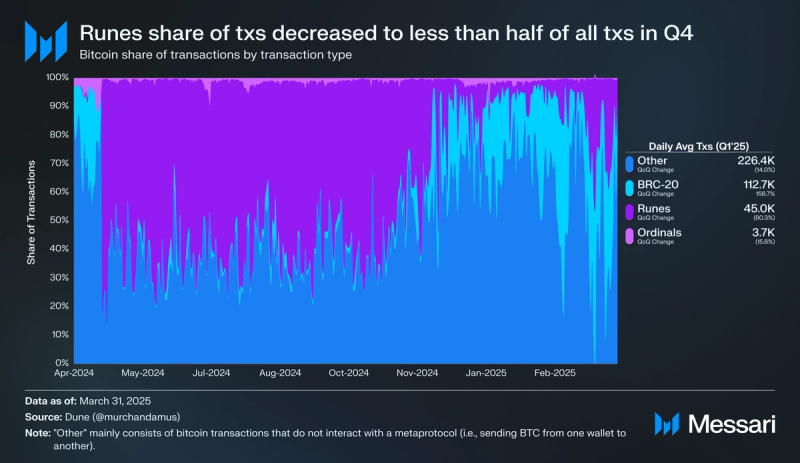
Since the introduction of runes in Q2’24, their usage has largely displaced and surpassed that of the BRC-20 fungible token standard. Runes are often viewed as more economically viable than BRC-20 due to BRC-20’s UTXO inefficiencies. However, in Q1, BRC-20 transactions surpassed runes transactions for the first time since both metaprotocols existed. Presumably, this was due to decreased transaction fees across the board, making BRC-20 transactions more attractive on a fee basis. Average daily BRC-20 transactions were up 157% QoQ from 44,200 to 112,700. This increase was primarily because of an increase in BRC-20 minting activity. Runes’ transactions trended in the opposite direction in Q1, falling 80% QoQ from 225,100 to 45,000. “Regular” transactions, transactions that do not interact with a metaprotocol, also saw a decrease in Q1, falling 14% QoQ from 263,200 to 226,400. Transactions that interacted with a metaprotocol (i.e., Ordinals, BRC-20, and Runes) were 39% of all transactions in Q1, down 19% QoQ.
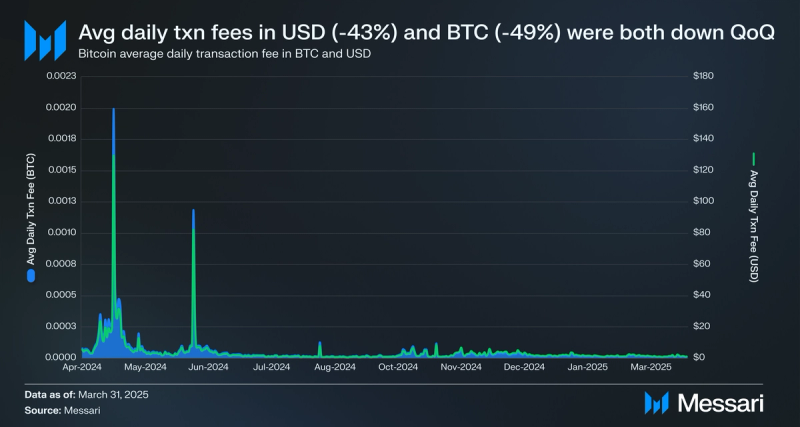
Bitcoin transaction fees are determined by the size of the transaction data (measured in bytes) and the number of transactions in the mempool. As such, transactions that interact with a metaprotocol typically incur higher fees than a normal BTC transfer. With activity related to metaprotocols decreasing, daily average transaction fees were down in Q1. Daily average transaction fees in BTC were down 49% QoQ to 0.00002 BTC, while in USD was down 43% QoQ to $1.50.
Mining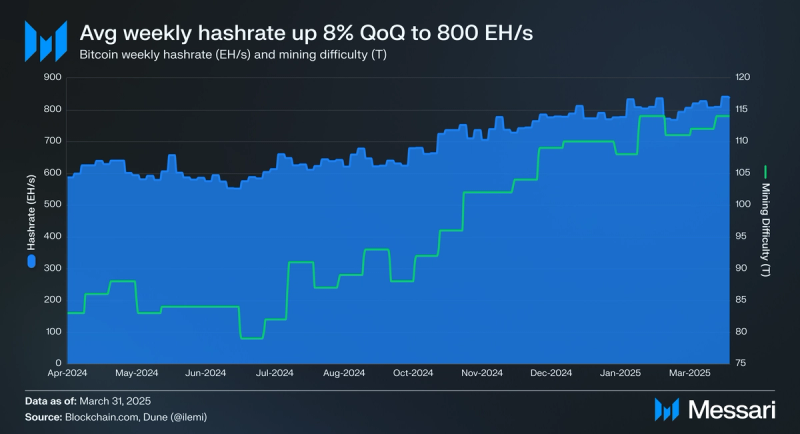
Hashrate represents the computational cost and resource demands faced by miners who secure the Bitcoin network. As hashrate increases, miner profitability decreases (assuming a constant BTC price and transaction activity). For Q1, the average weekly hashrate increased 8% QoQ from 738 EH/s to 800 EH/s (exahashes per second). Once again, hashrate set new all-time highs in Q1. For mining difficulty, it readjusts every 2,016 blocks (~2 weeks) based on the network’s hashrate. As such, the higher the hashrate, the higher the mining difficulty. Average weekly mining difficulty increased 11% QoQ from 100 T to 111 T (trillion).
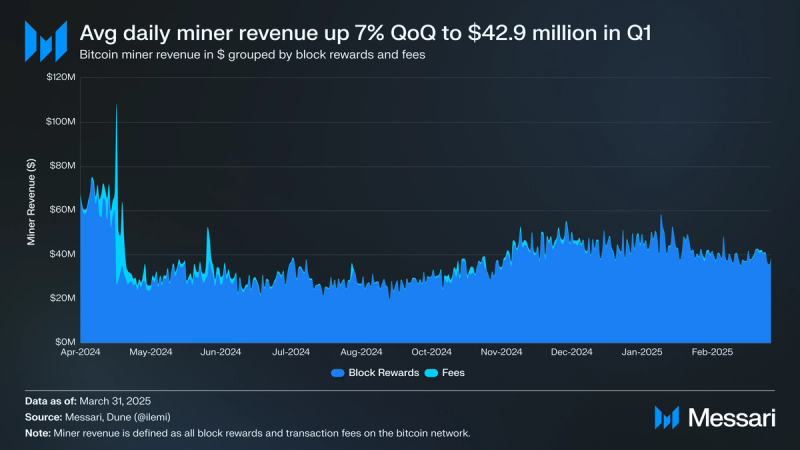
Miner revenue is the sum of all block rewards and network fees, denominated in USD. Since a miner’s costs are denominated in USD (electricity, equipment, land, etc.), miner revenue in USD must outpace mining costs for a miner to be profitable. Therefore, miner revenue increases with rising BTC prices and network fees. Additionally, each halving tends to have a negative impact on miner revenue as block rewards represent the majority of miner revenue. In Q1, average daily miner revenue increased by 7% QoQ from $40.1 million to $42.9 million. Block rewards represented 99% of miner revenue (up 2% QoQ), while network fees were 1% of miner revenue (down 61% QoQ).
Ecosystem Overview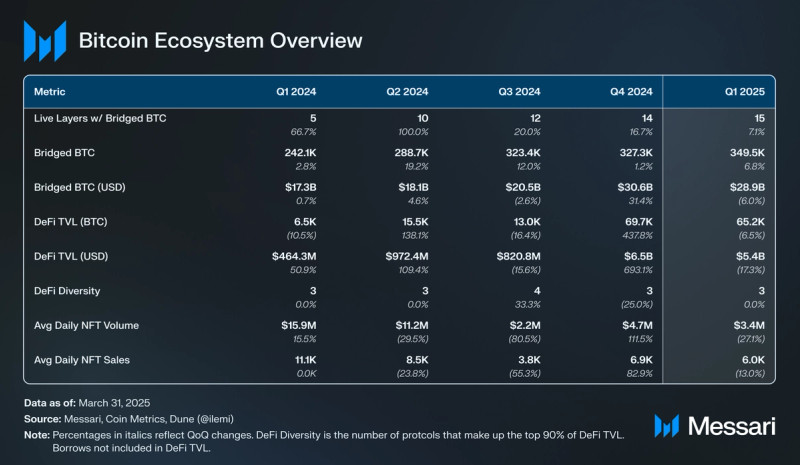 Layers
Since 2023, Bitcoin has experienced a resurgence in demand and development activity for protocols scaling or adding increased functionality to Bitcoin. These protocols vary but are colloquially referred to as “Bitcoin layers.” According to Bitcoin Layers, an open-source platform that tracks the development and activity of these protocols, a Bitcoin layer is “a deliberately ambiguous term that encapsulates L2s, sidechains, state chains, and other networks 'aligned' with either bitcoin (the network) or BTC (the asset).“
For the purposes of this report, networks that support a bridged version of BTC have been split into three different categories:
- Alt L1s & More (i.e., Ethereum, Solana, Arbitrum, etc.) - Networks that support bridged version(s) of BTC, but the underlying network is sovereign from the Bitcoin network.
- Sidesystems (i.e., Stacks, Merlin, Core, etc.) - Networks that support bridged versions(s) of BTC and provide offchain execution for Bitcoin users.
- Bitcoin Native (i.e., Lightning Network) - Networks that support bridged version(s) of BTC and allow users to unilaterally exit the offchain system back to Bitcoin.
A more in-depth analysis of the difference between these categorizations can be found here. For the purposes of this report, sidesystems and Bitcoin native both are considered Bitcoin layers.
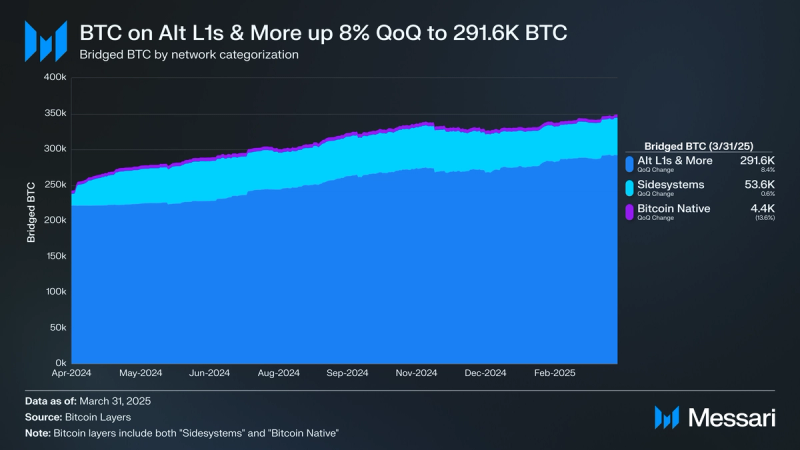
Bridged BTC across all networks increased by 7% QoQ from 327,300 to 349,500 in Q1. In USD terms, bridged BTC was down 6% QoQ from $30.56 billion to $28.85 billion. Broken down by category, Alt L1s & more was responsible for this growth as its bridged BTC increased 8% QoQ to 291,600. By the end of the quarter, 83% of all bridged BTC was on alt L1s & more, 15% on sidesystems, and 1% on Bitcoin native networks.
By the end of Q1, there were 15 different Bitcoin layers with bridged BTC (up 1 from 14 in Q4):
- Merlin (Sidesystem) - Down 8% QoQ to 21,600 BTC
- Core (Sidesystem) - Down 36% QoQ to 5,800 BTC
- Bsquared Network (Sidesystem) - Down 15% QoQ to 4,700 BTC
- Lightning Network (Bitcoin Native) - Down 14% QoQ to 4,400 BTC
- Bitlayer (Sidesystem) - Down 1% QoQ to 3,900 BTC
- Hemi (Sidesystem - Q1 Launch) - 3,900 BTC
- Liquid (Sidesystem) - Up 1% QoQ to 3,800 BTC
- Stacks (Sidesystem) - Up 162% QoQ to 3,300 BTC
- BOB (Sidesystem) - Up 11% QoQ to 3,200 BTC
- Rootstock (Sideystem) - Flat QoQ at 3,100 BTC
- Internet Computer (Sidesystem) - Up 45% QoQ to 294 BTC
- Rollux (Sidesystem) - Flat QoQ at 60 BTC
- Corn (Sidesystem) - Down 51% QoQ to 27 BTC
- BEVM (Sidesystem) - Down 59% QoQ to 9 BTC
- Libre (Sidesystem) - Down 25% QoQ to 1 BTC
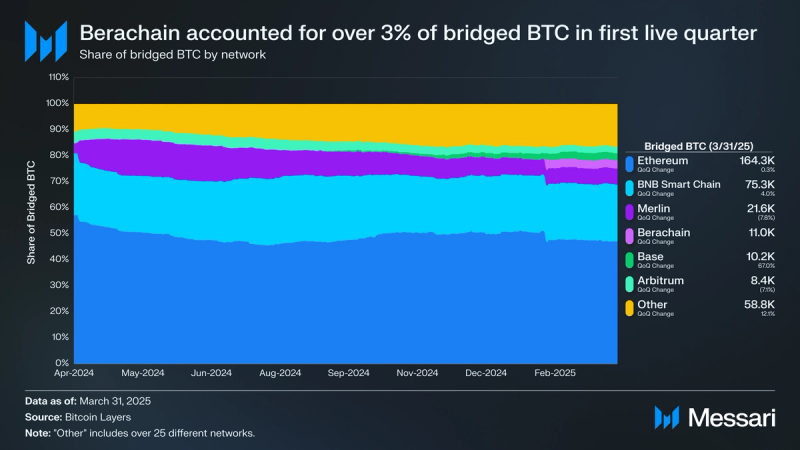
Berachain, an L1 that launched in Q1, quickly became one of the top networks by BTC bridged, ending the quarter with 11,000 BTC (4th most amongst all networks). Berachain’s Proof-of-Liqudity (PoL) mechanism has made its DeFi yields attractive, leading to a surge of bridged BTC. Another notable gainer was Base, which saw its bridged BTC increase 67% QoQ from 6,100 to 10,200. Coinbase’s cbBTC has made BTC more accessible to users on the network. Ethereum remained the network with the most bridged BTC, essentially flat QoQ at 164,300.
DeFi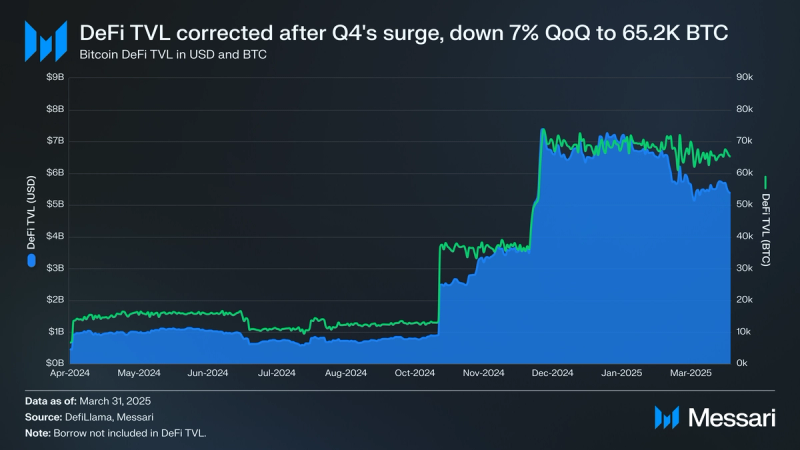
Bitcoin DeFi TVL denominated in USD decreased from $6.51 billion in Q4 to $5.38 billion, a 17% QoQ decrease. This ranked Bitcoin as the 3rd highest chain by TVL, denominated in USD, by the end of the quarter, rising 1 spot from 4. Furthermore, Bitcoin accounted for nearly 5% of all DeFi TVL. TVL denominated in BTC was also down in Q1, decreasing 7% QoQ from 69,700 to 65,200 BTC.
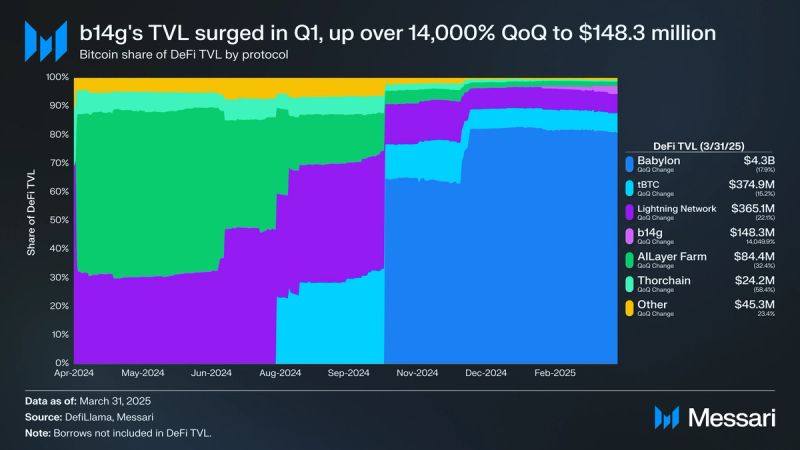
In 2024, the Bitcoin DeFi ecosystem blossomed, with various new projects launching to expand DeFi and staking on Bitcoin. One protocol that has had an outsized influence on this growth is Babylon. Babylon is Bitcoin’s first staking protocol built directly on the Bitcoin network, offering a unique approach to leveraging Bitcoin's immense economic security. The protocol enables Bitcoin holders to stake their BTC, providing security for other networks in exchange for staking rewards. This system resembles Ethereum’s EigenLayer, with the caveat being that Babylon aims to harness Bitcoin’s $1.6 trillion market cap, making it an even more attractive asset for shared security. By the end of Q1, Babylon’s DeFi TVL stood at $4.34 billion, down 18% QoQ from $5.29 billion. Since Babylon’s TVL is denominated in BTC, this decrease was primarily due to the price depreciation of BTC, not capital outflows. 82% of Bitcoin’s DeFi TVL is on Babylon (flat QoQ).
One notable gainer in Q1 was b14g, another BTC staking protocol that allows BTC stakers to contribute economic security to the sidesystem Core in return for CORE tokens and other rewards. Its TVL increased by 14,050% from $1.0 million to $148.3 million. Notably, no other protocol within the top 6 experienced a TVL gain in Q1.
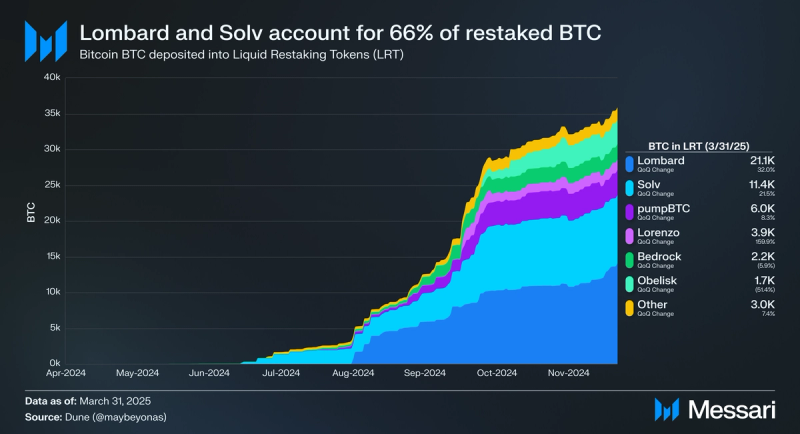
Liquid Restaking Tokens (LRTs) allow staked BTC to be restaked into Babylon and other restaking protocols, enabling native yield while maintaining liquidity and DeFi composability. Bitcoin’s restaking ecosystem has taken off alongside the rise of Babylon, with over 11 different live LRTs by year-end. BTC deposits in LRTs saw continued growth in Q1, up 20% QoQ from 41,000 to 49,200 BTC. The most popular LRT by BTC deposited is Lombard. BTC deposits in Lombard grew 32% QoQ from 16,000 to 21,000. Furthermore, 43% of all BTC deposited in LRTs was in Lombard. Lombard has benefited from its wide array of supported networks and DeFi integrations. After Lombard, the next largest BTC LRT was Solv. BTC deposits in Solv increased 22% QoQ from 9,400 to 11,400. Solv’s share of the BTC LRT market stood at 23% by quarter end. Similar to Lombard, Solv boasts a deep assortment of DeFi integrations. Rounding out the top 3 is pumpBTC, which saw its deposits increase 8% QoQ from 5,500 to 6,000. Combined, Solv, Lombard, and pumpBTC collectively held over 78% of the BTC deposited in LRTs, up 4% QoQ from 75%.
NFTs and Onchain Trading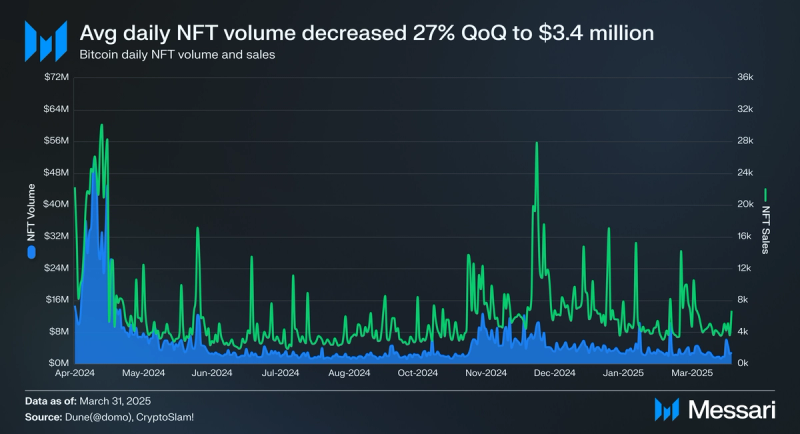
NFT activity has continued its steady decline since peaking in Q1’24. As a result, the average daily NFT trading volume in Q1 decreased 27% QoQ from $4.7 million to $3.4 million. Average daily sales also saw a decrease, down 13% QoQ from 6,900 to 6,000. Despite the decline in activity, one of the largest ordinal mints occurred in Q1. Taproot Wizards, one of the most anticipated NFT collections on Bitcoin, finally minted at the end of March. The final clearing price for the mint was 0.31 BTC.
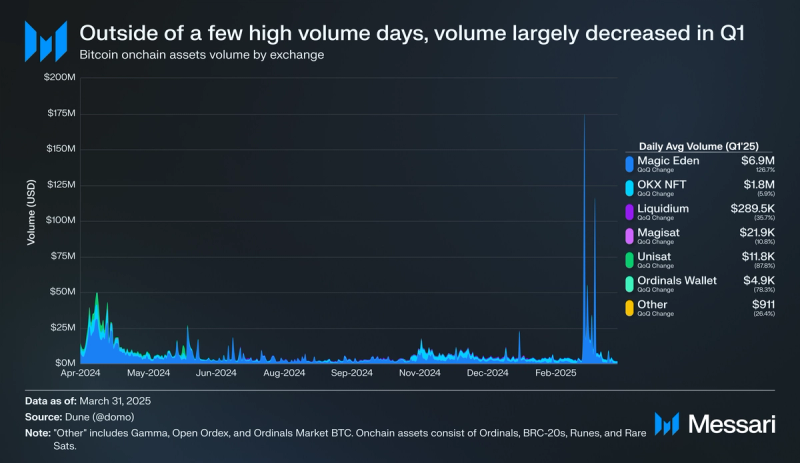
Broken down by exchanges, Magic Eden once again accounted for the majority of onchain asset volume. However, the majority of its volume occurred on a select few days: March 1 ($173.5 million), March 3 ($53.4 million), and March 8 ($114.5 million). Given that no notable assets on Magic Eden experienced abnormal price volatility on these dates, it’s likely that these volume spikes can be attributed to wash trading. Nevertheless, Magic Eden’s daily average volume increased 127% QoQ from $3.1 million to $6.9 million. Its share of volume was 76%, up 40% QoQ. No other notable exchange experienced a QoQ increase in daily average volume. The top five exchanges by daily average onchain asset volume in Q1 are as follows:
1. Magic Eden - $6.9 million (up 127% QoQ)
2. OKX’s NFT Marketplace - $1.8 million (Down 6% QoQ)
3. Liquidium - $289,500 (Down 36% QoQ)
4. Magisat - $21,900 (Down 11% QoQ)
5. UniSat - $11,800 (Down 89% QoQ)
Closing SummaryBitcoin entered 2025 with momentum but faced a correction in Q1, driven by broader macro headwinds and risk-off sentiment. Despite reaching a new all-time high in January, BTC closed the quarter down 12% as geopolitical developments, including new U.S. tariffs, impacted risk assets across the board. Yet, structural support for Bitcoin remains strong. ETF inflows persisted, institutional holdings grew, and the U.S. government’s launch of a Strategic Bitcoin Reserve marked a notable shift in Bitcoin’s role as a sovereign asset.
Onchain activity softened across most metrics, with declines in transaction counts, metaprotocol usage, and fee generation. Still, the network’s fundamentals remained intact: hashrate reached new highs, miner revenue increased, and infrastructure for Bitcoin’s broader ecosystem continued to develop. Bridged BTC and restaking protocols saw meaningful growth, and although DeFi TVL in USD terms declined, BTC-denominated participation held relatively steady. As Q2 approaches, Bitcoin’s positioning remains resilient, buoyed by maturing institutional infrastructure and ongoing experimentation across Bitcoin-native and aligned ecosystems.