and the distribution of digital products.
Visualizing PostgreSQL Data With Angular To Analyze What Passengers Find Rude to Do During a Flight
The Angular framework has recently undergone major updates, including a brand-new website. I decided to refresh my Angular skills and develop a small project. Given my background in data analysis, I opted to create a data visualization dashboard using an interesting dataset.
Project OverviewFor this project, I explored data from the "41 Percent of Fliers Say It’s Rude To Recline Your Airplane Seat" article. This dataset provided a light-hearted yet insightful foundation for my dashboard.
Development StackAs it’s a small pet project to try out my skills with the new Angular version, I also tried to use a combination of tools that was new for me and make it a bit more interesting. So the final stack looked like this:
\
- Framework: Angular 18, the latest version of the popular framework.
- Database: PostgreSQL, hosted on the ElephantSQL free service.
- Data visualization tool: Flexmonster Pivot Table & Charts, a JavaScript library for web reporting.
\ I considered several options for data visualization tools, but Flexmonster stood out for its ability to handle the data volume efficiently and provide quick integration into my stack. It also has both charts and pivot functionality available out-of-the-box.
Implementation Steps- Setting Up Angular: I started by setting up an Angular project using Angular CLI. This included creating components, services, and routing modules.
- Configuring PostgreSQL: I set up a PostgreSQL database on ElephantSQL, ensuring that the data was correctly structured and optimized for querying.
- Integrating Flexmonster: Using Flexmonster's API, I integrated the pivot table and charts into my Angular application. This step involved customizing the visualizations to match the dataset and enhance user interactivity.
Let's create a basic Angular project with the following commands:
ng new flying-etiquette --no-standalone --ssr=false --style=css
cd flying-etiquette
Now we will continue with the data source configuration.
Creating a PostgreSQL databaseLet's create a PostgreSQL database and fill it with data from the CSV file so we can analyze passengers' feelings about certain behaviors.
\ I've used the ElephantSQL service to create a remote PostgreSQL instance for free. Unfortunately, the service is shutting down and new accounts cannot be created. Feel free to use other similar services, such as Render, Neon, or Amazon RDS.
\ To manage the database, I've used DBeaver. It's a free cross-platform solution that provides many useful features for working with different SQL databases.
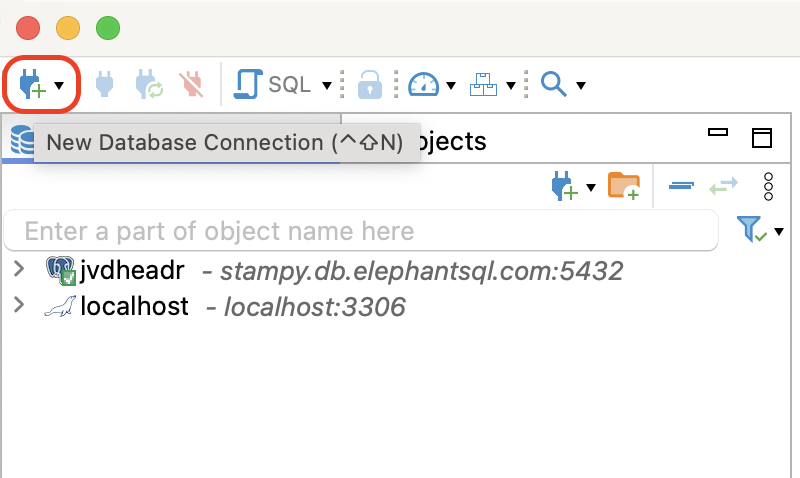
\ Connect DBeaver to your remote database in the following way:
- Click the New Database Connectionbutton in the top left corner: \n
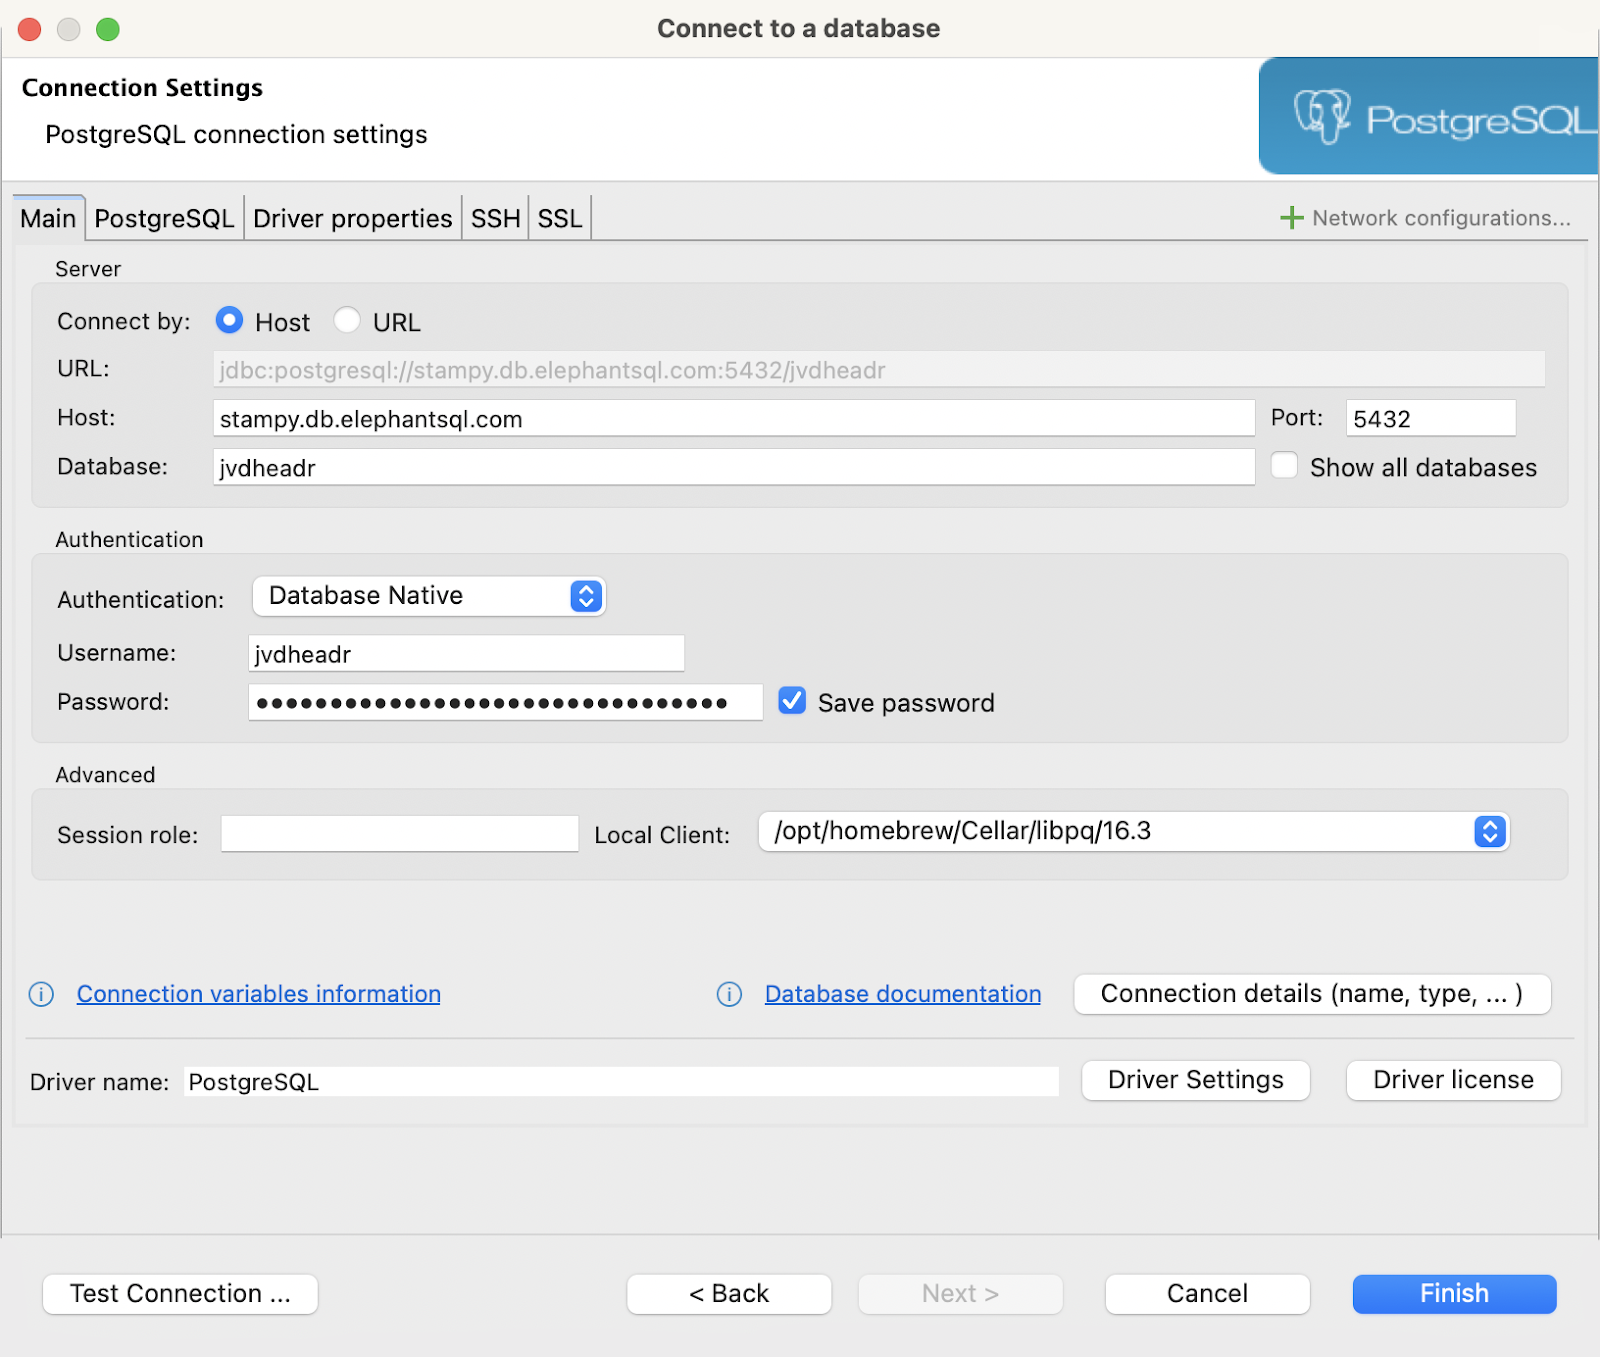
- In the popup window, choose the PostgreSQL database option and click Next.
- Fill in the information for connecting to your database and click Finish. Here's an example: \n
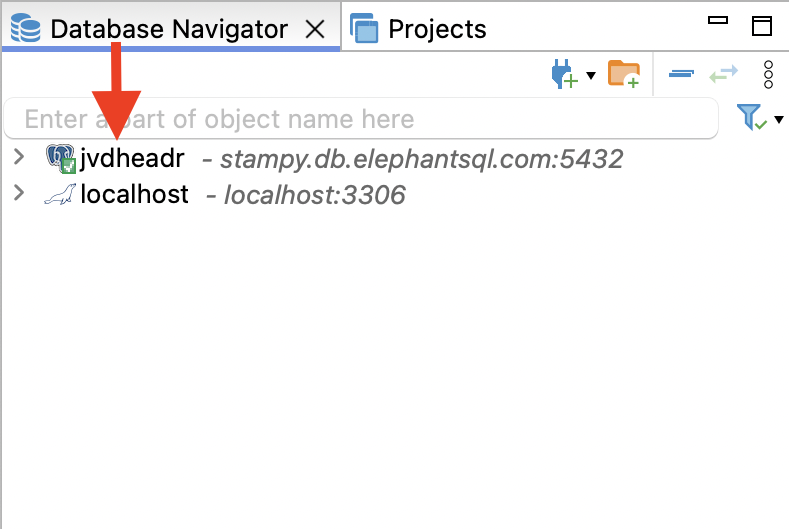
Once the connection has been established, your database instance will appear in the Database Navigator list:
\
\ After downloading the CSV file with data, import it to the PostgreSQL database in the following way:
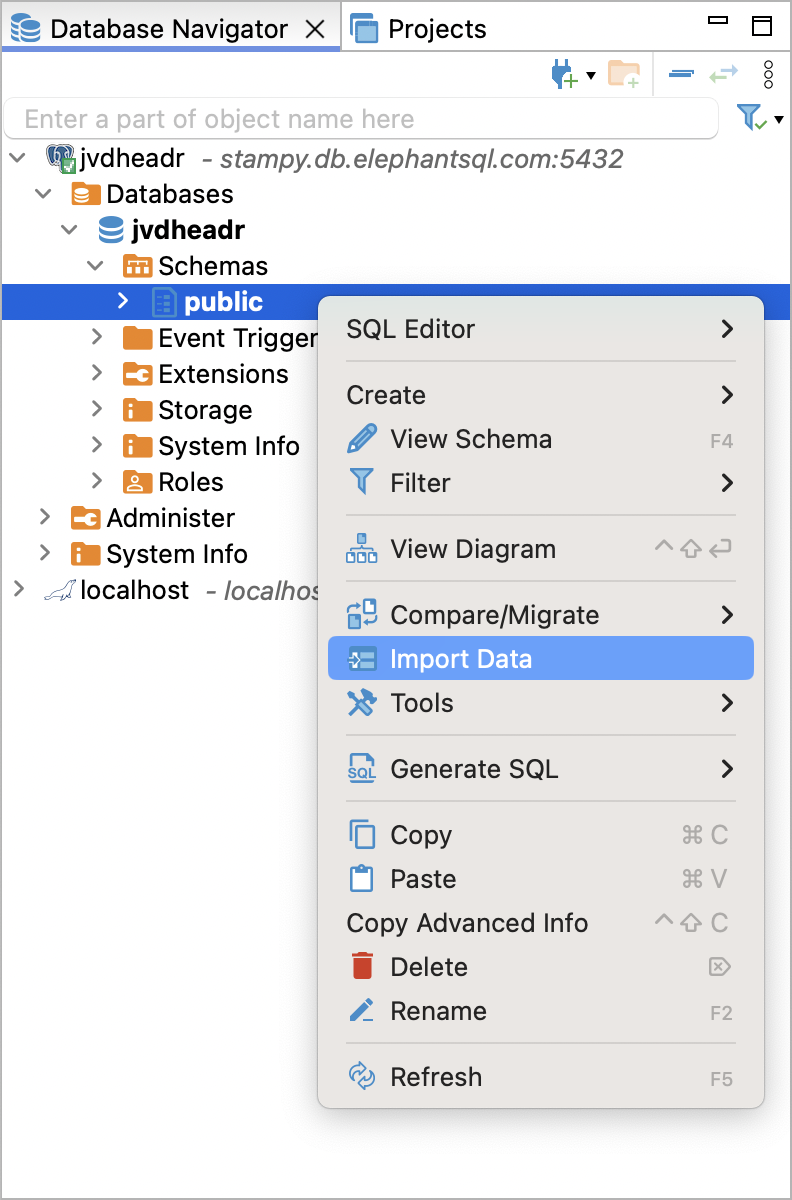
- In the Database Navigator, go to your database connection (e.g., jvdheadr) -> Databases -> database name (e.g., jvdheadr) -> Schemas.
- Right-click the schema name where you want to import the data (e.g., public) and select Import Data. \n
- In the popup window, choose the CSV import source and click Next.
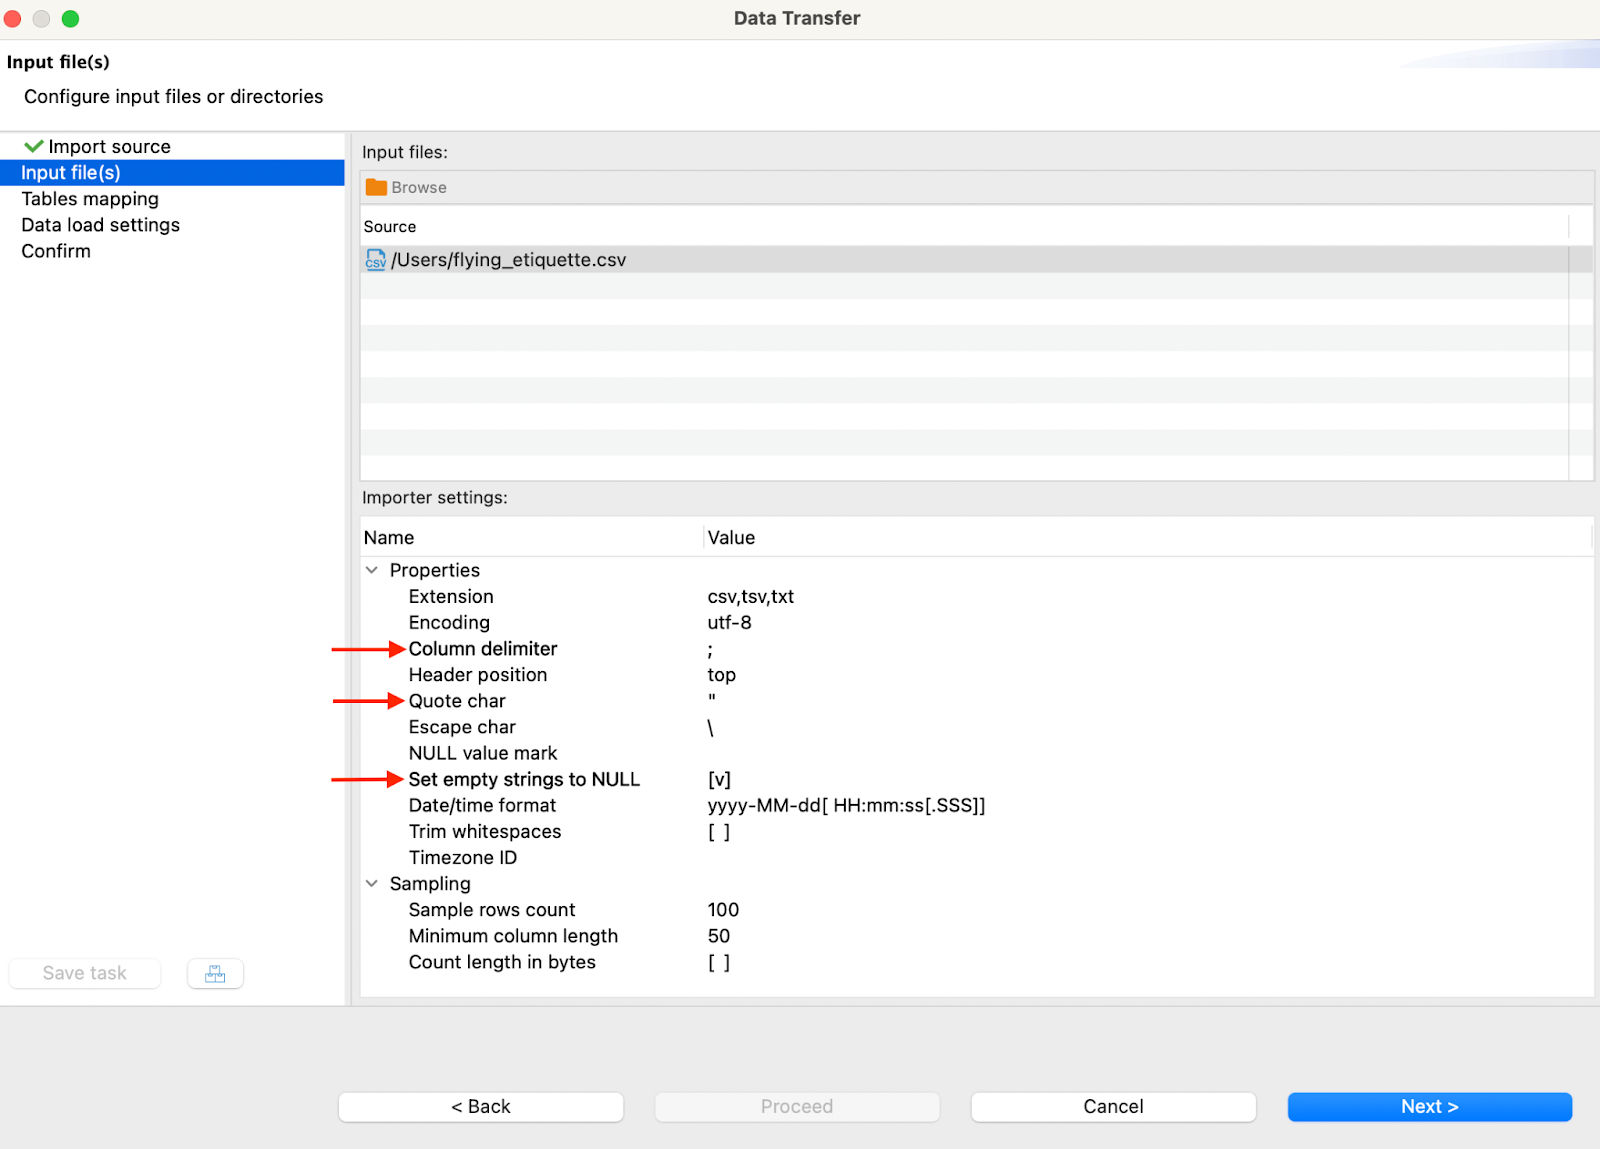
- Locate the CSV data file on your computer. Then, ensure the Importer settings are configured correctly. Pay special attention to the Column identifier, Quote char, and Set empty strings to NULL options. Once you are finished, click Next. \n
- Configure the Tables mapping. If you are okay with the default configuration, click Next.
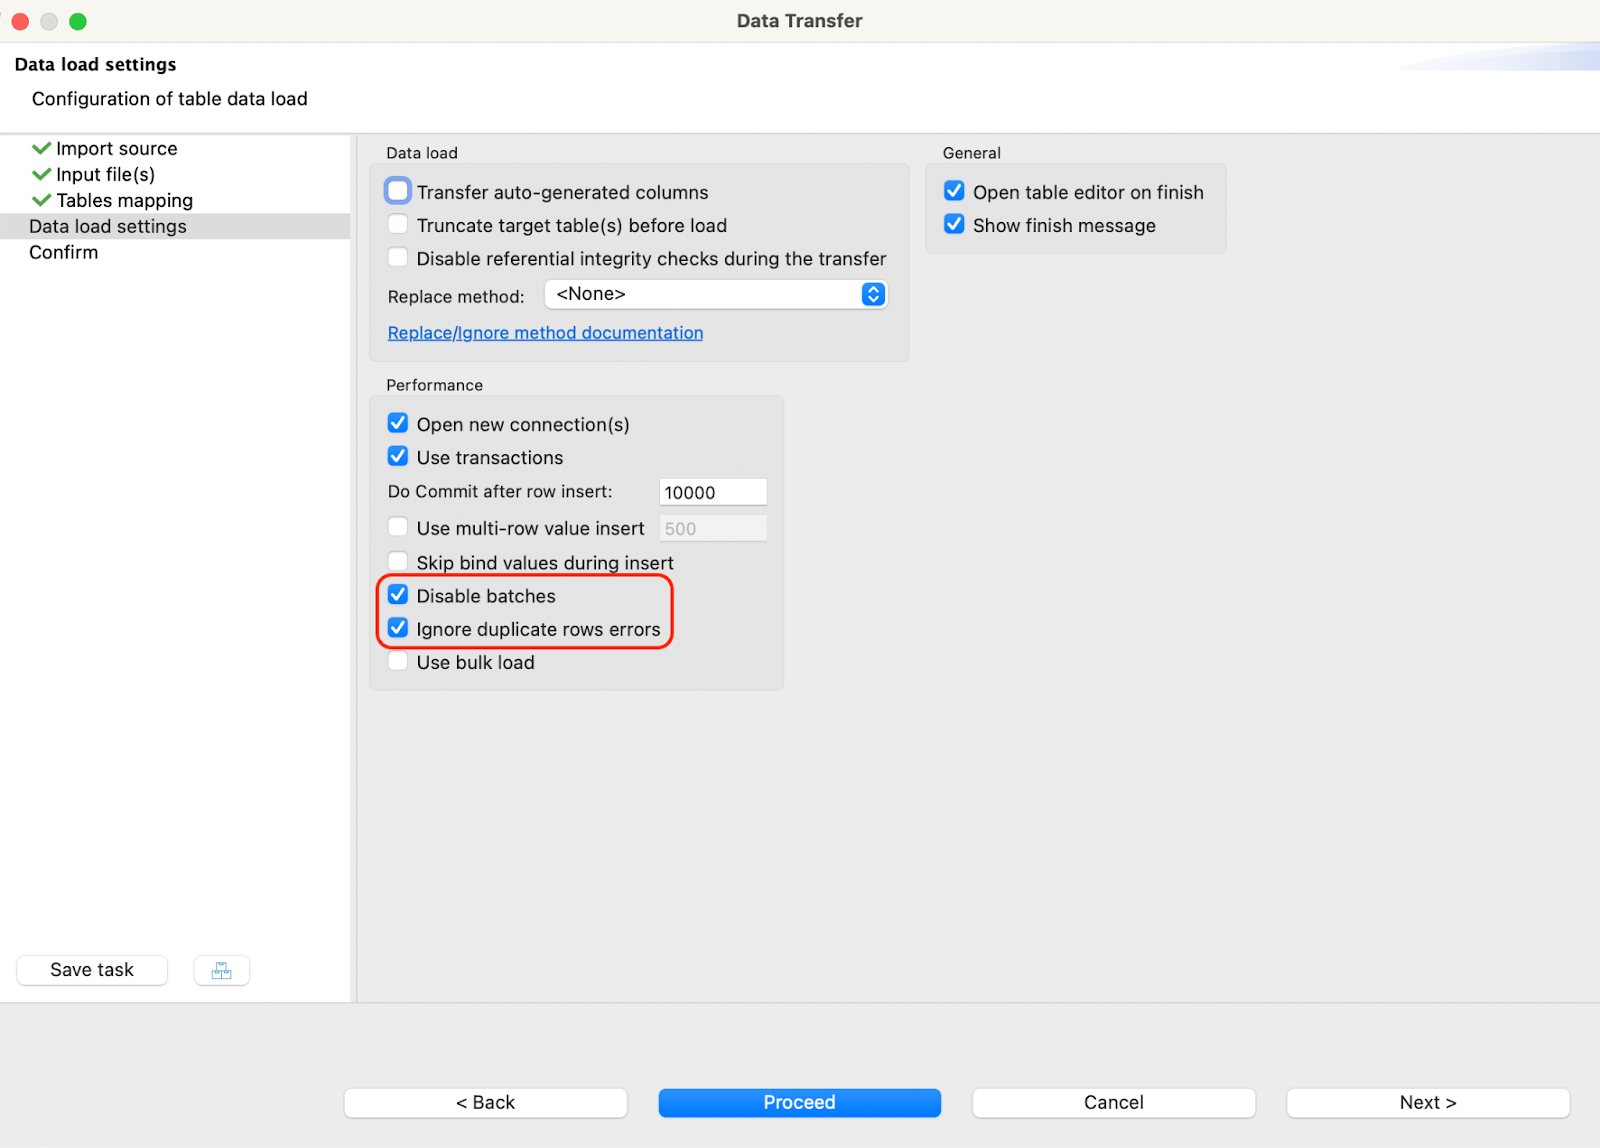
- To avoid errors, check the Disable batches and Ignore duplicate rows errors options. Then, click Proceed. \n
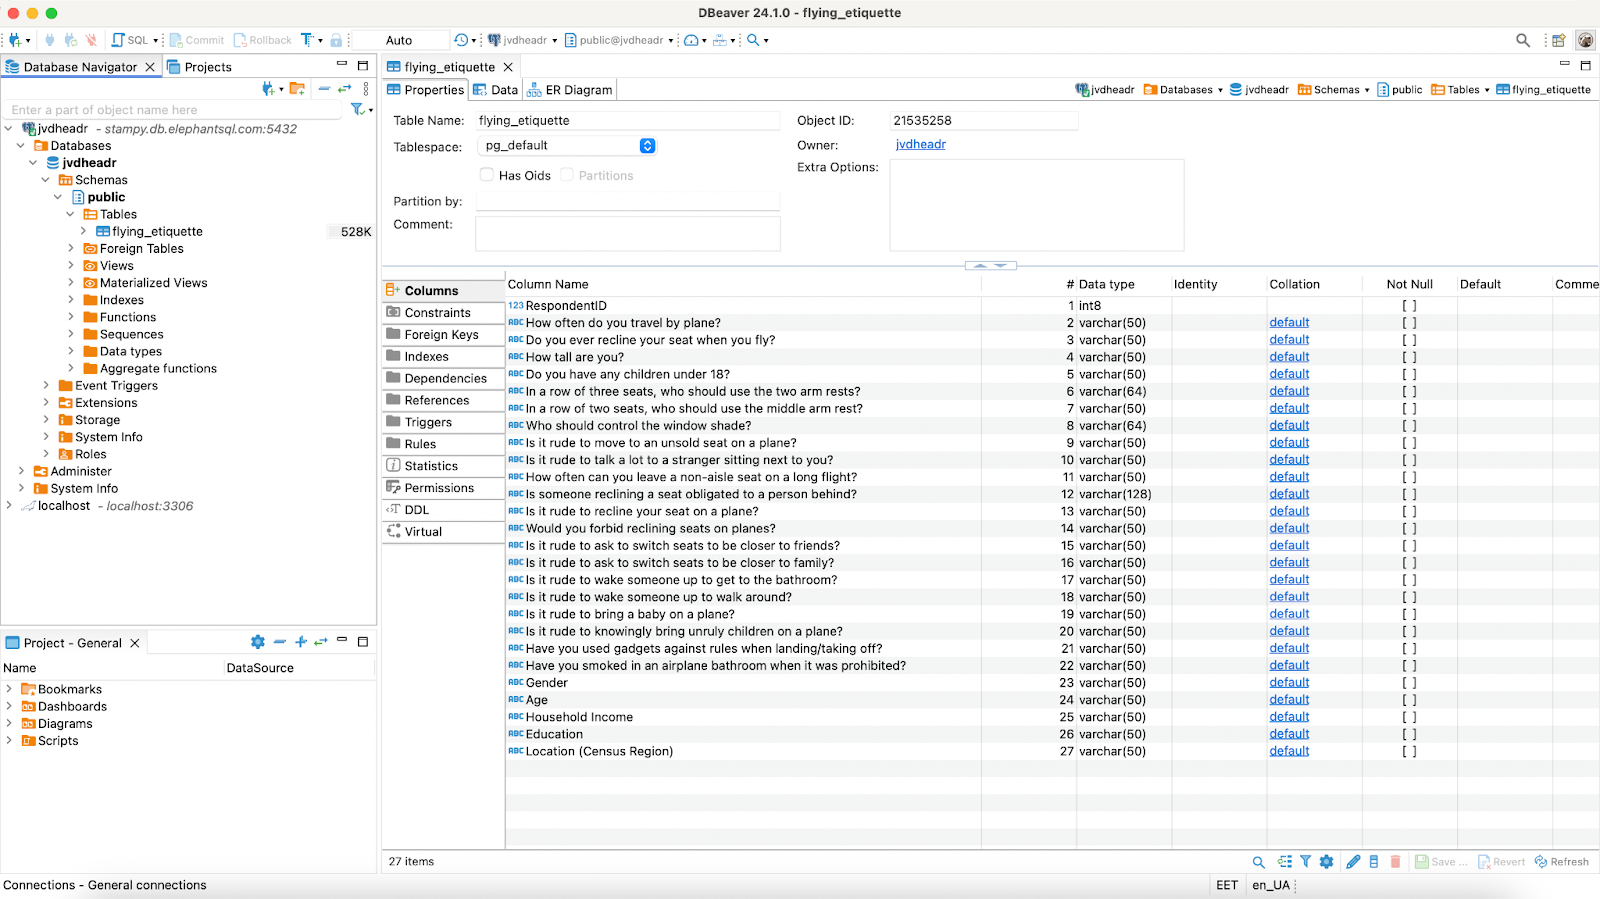
Once the data is imported, you will see the newly created table. Check if all columns and data were exported correctly.
Now we have a configured database. Searching through the guides on installing Flexmonster I discovered it has a special Data Server, that optimizes the work with different data sources. The process was also very straightforward so I decided to stick to this option. But let’s install the tool itself first.
Installing FlexmonsterTo install and configure Flexmonster for our project, install Flexmonster CLI:
npm install -g flexmonster-cli
Flexmonster CLI provides quick and convenient access to all the Flexmonster tools.
\ Once the Flexmonster CLI is installed, open the newly created project in a rich text editor or an IDE of your choice. Personally, I use Visual Studio Code. However, if you prefer working only with the terminal or a command line interface, you are welcome to continue doing it.
\ Install Flexmonster Angular wrapper for our project using Flexmonster CLI:
flexmonster add ngx-flexmonster
\ Then, import FlexmonsterPivotModule into src/app/app.module.ts file located in our project:
\
import { FlexmonsterPivotModule } from 'ngx-flexmonster'; @NgModule({ // ... imports: [ FlexmonsterPivotModule, // Other imports ], // ... })\ And import Flexmonster styles into src/styles.css file:
\
@import "flexmonster/flexmonster.min.css";\
Finally, insert the
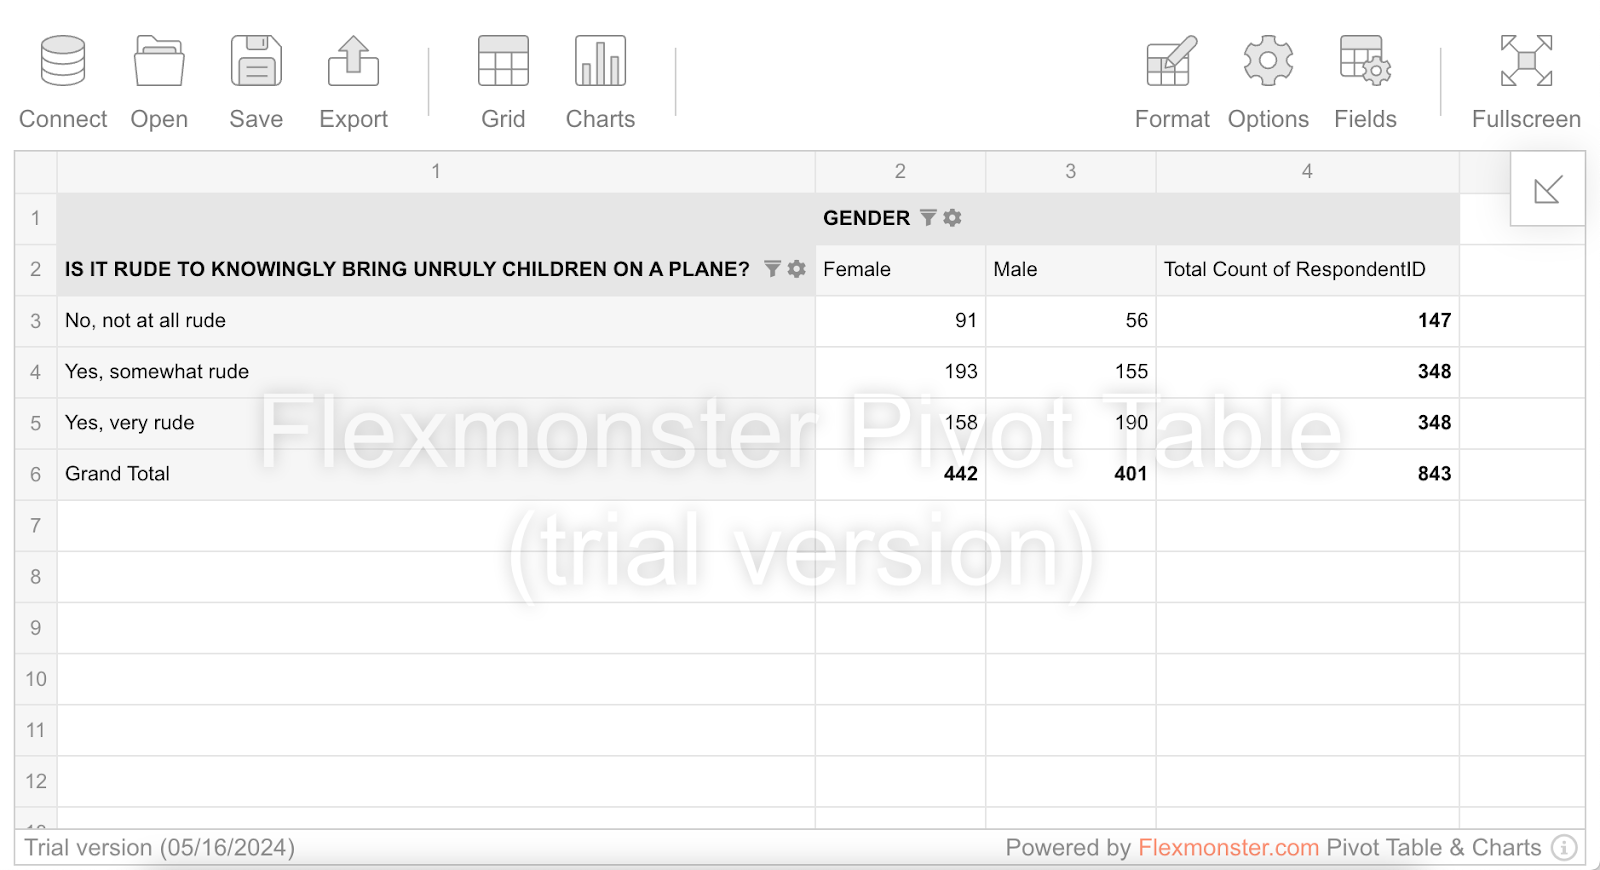
\ If you start the project at this stage, you will see a pivot table, but it's empty. Let's fix this by connecting a PostgreSQL database and Flexmonster.
Connecting to the PostgreSQL databaseNow that Flexmonster has been added to the Angular project and our database has been created, we need to connect Flexmonster to the database. To do this, we need to use Flexmonster Data Server. Here's how this tool works:
\
- Connects to various data sources.
- Aggregates data on a server.
- Sends the aggregated data to Flexmonster.
\ The Data Server can be installed with the following command:
flexmonster add fds -r
\ The -r flag will automatically open the Data Server after it's installed.
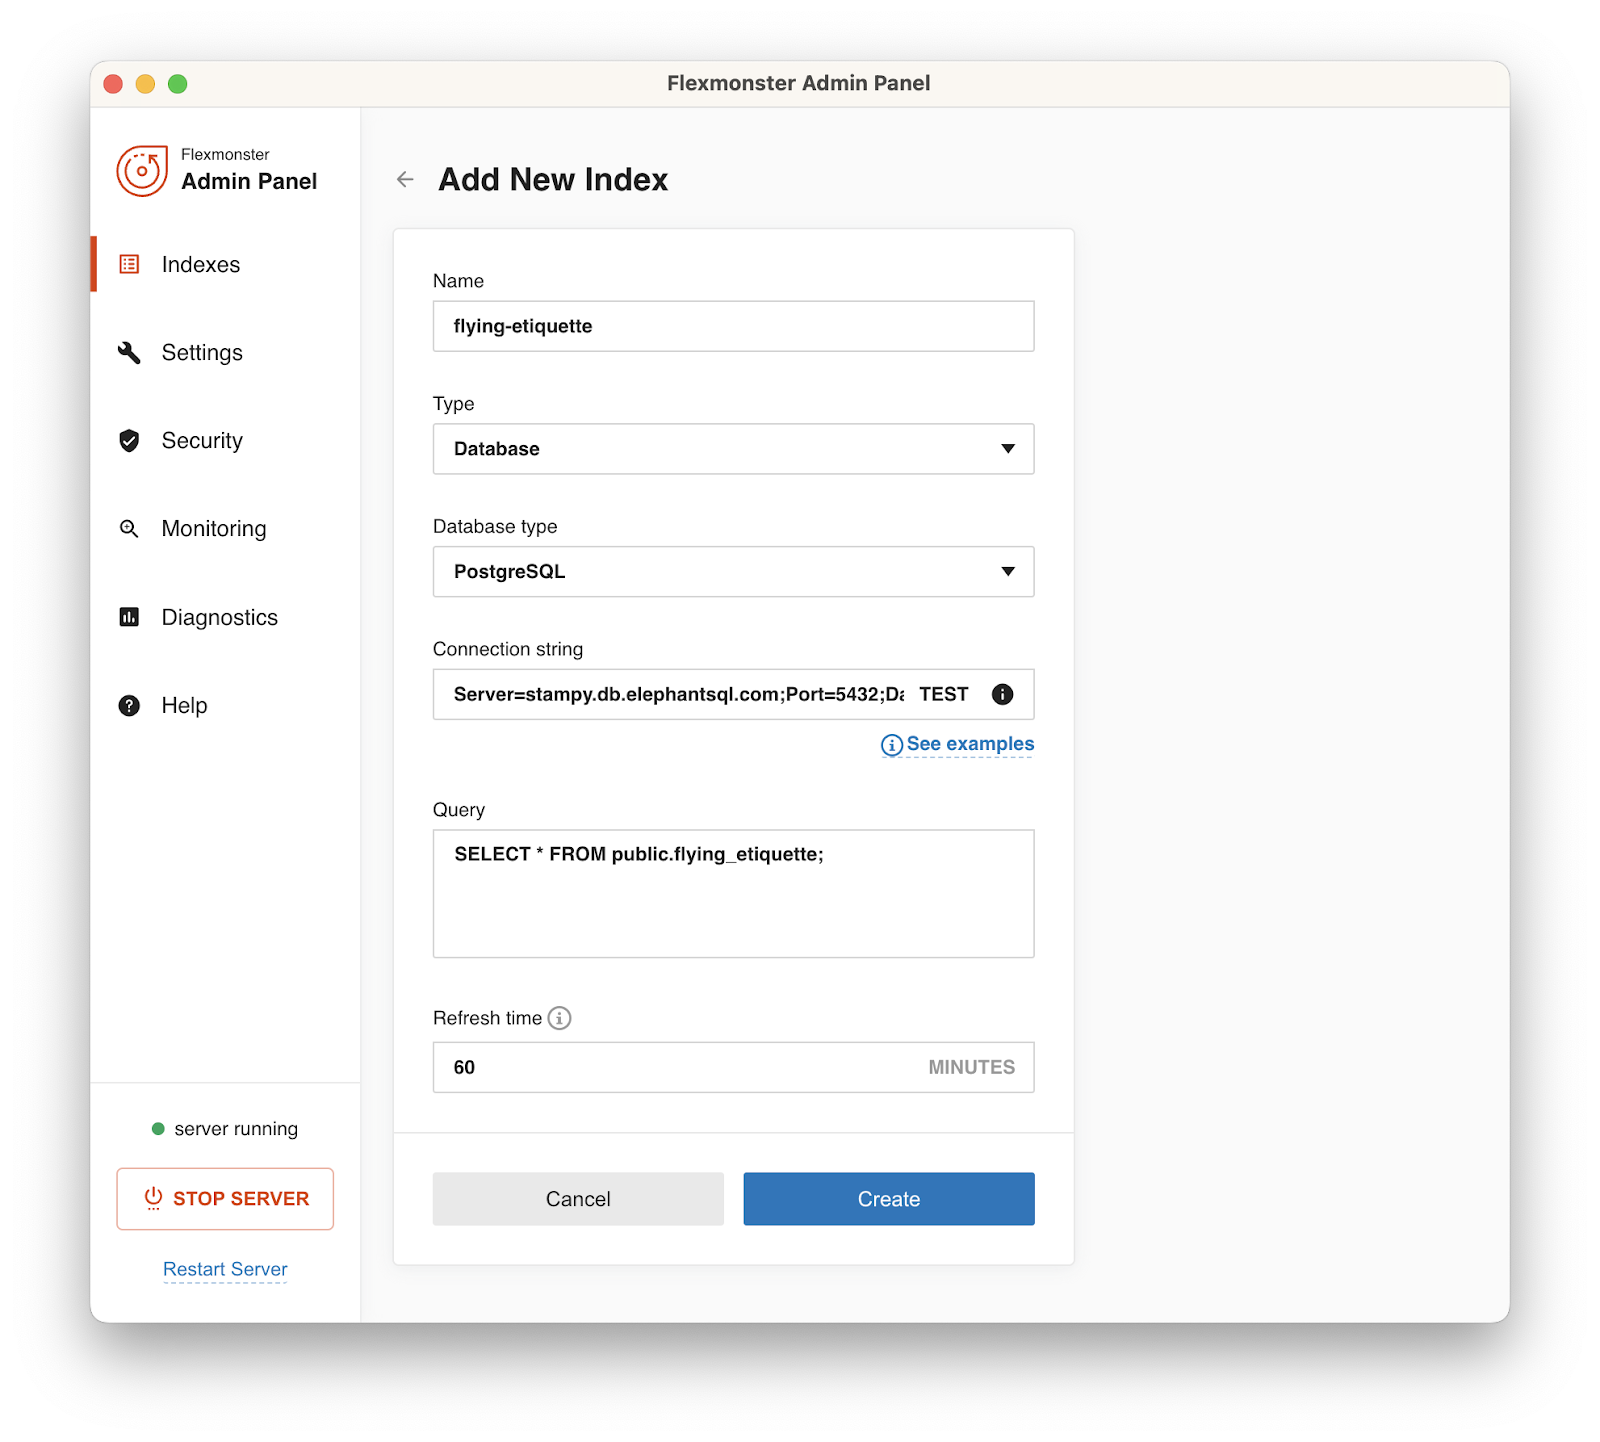
\ Let's establish a connection between the Data Server and the database:
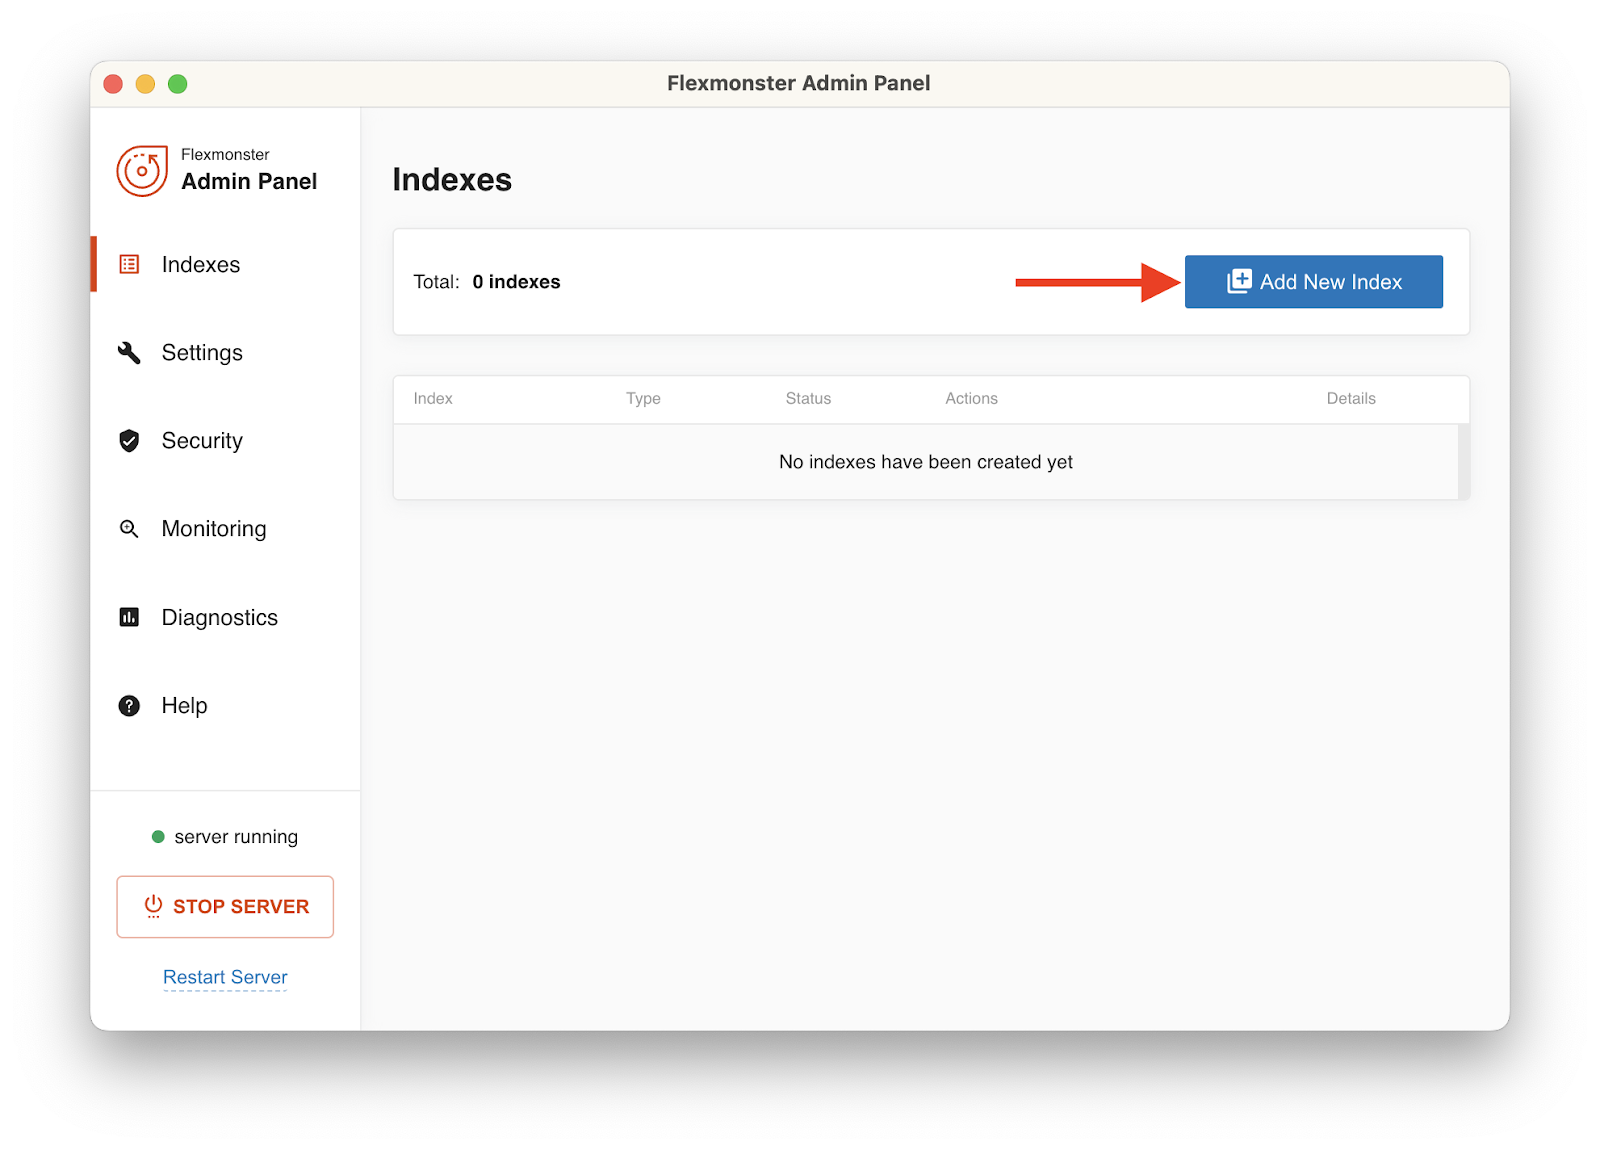
\ Step 1. Click the "Add New Index" button:
\ Step 2. Fill in the information about the index so it is similar to the following and click "Create":
\ Here's a connection string to the sample PostgreSQL database:
Server=stampy.db.elephantsql.com;Port=5432;Database=jvdheadr;User Id=jvdheadr;Password=4O7qgJ2C9VONkyn0Bp57V1I2EFggBhXd;
\
Now let's connect Flexmonster Pivot to the Data Server. Specify the [report] attribute for the
\
\ Finally, let's preset which fields should be displayed in the pivot table, so we can visualize data as soon as the page loads:
\ And that's it! Our project is ready. Let's start it by running the following command:
npm start
\ When the project is built, you will see the pivot table and be able to analyze the data.
\ You can get the ready-to-use version of this project on my GitHub and use it as a starting point when developing your own app or simply to explore the dataset
ConclusionThe overall process of creating an Angular app, embedding the visualization tool and connecting it to PostgreSQL is pretty straightforward and fast to perform. So you can easily use this as a tutorial or an example for your Angular reporting application. Plus, now you get to know things people consider the rudest to do on your airplane trip!)
- Home
- About Us
- Write For Us / Submit Content
- Advertising And Affiliates
- Feeds And Syndication
- Contact Us
- Login
- Privacy
All Rights Reserved. Copyright , Central Coast Communications, Inc.
