and the distribution of digital products.
The TechBeat: RootstockCollective In-Depth: Empowering Bitcoin Builders (12/29/2024)
In the ==first part of this tutorial== series, we took the first steps for building an end-to-end MLOps pipeline using Databricks and Spark, guided by Databricks' reference architecture. Here's a recap of the key steps we covered:
\
Setting Up the Unity Catalog for Medallion Architecture: We organized our data into bronze, silver, and gold layers within the Unity Catalog, establishing a structured and efficient data management system.
Ingesting Data into Unity Catalog: We demonstrated how to import raw data into the system, ensuring consistency and quality for subsequent processing stages.
Training the Model: Utilizing Databricks, we trained a machine learning model tailored to our dataset, following best practices for scalable and effective model development.
Hyperparameter Tuning with HyperOpt: To enhance model performance, we employed HyperOpt to automate the search for optimal hyperparameters, improving accuracy and efficiency.
Experiment Tracking with Databricks MLflow: We utilized MLflow to log and monitor our experiments, maintaining a comprehensive record of model versions, metrics, and parameters for easy comparison and reproducibility.
\
With these foundational steps completed, your model is now primed for deployment. In this second part, we'll focus on integrating two critical components into our system:
\
- Batch Inference: Implementing batch processing to generate predictions on large datasets, suitable for applications like bulk scoring and periodic reporting.
- Online Inference (Model Serving): Setting up real-time model serving to provide immediate predictions, essential for interactive applications and services.
- Model Monitoring: to ensure your deployed models maintain optimal performance and reliability over time.
\ Let's get into it!
Model DeploymentThe departure point of the last blog was model evaluation. Now imagine we did the comparison and found that our model shows a higher performance compare to this production model. As we want (assume) to use the model in production, we want to take advantage of all the data that we have. The next step is to train and test the model using the full dataset. Then persist our model for later use by deploying it as our champion model. Since this is the final model that we want to use for inference, we use the Feature Engineering client to train the model. This way we are not only track the model lineage easier, but also offload the schema validation and feature transformation (if any) to the client.
\
with mlflow.start_run(run_name="ALS_best_model") as run: als = ALS() # Now we set the parameters for the method als.setMaxIter(MAX_ITER)\ .setSeed(SEED)\ .setRegParam(best_params["REG_PARAM"])\ .setUserCol(COL_USER)\ .setItemCol(COL_ITEM)\ .setRatingCol(COL_LABEL)\ .setRank(best_params["RANK"]) mlflow.log_param("MAX_ITER", MAX_ITER) mlflow.log_param("RANK", best_params["RANK"]) mlflow.log_param("REG_PARAM", best_params["REG_PARAM"]) # Create the model with these parameters. model = als.fit(df_full_data) #drop predictions where users and products from the test test and didn't make it into the training set. in this case, the prediction is NaN model.setColdStartStrategy('drop') predictions = model.transform(df_full_data) signature = infer_signature(model_input = df_full_data, model_output = predictions.select(COL_LABEL)) #log the model mlflow.spark.log_model(model, model_name, sample_input=df_full_data.limit(3), signature = signature, conda_env=mlflow.spark.get_default_conda_env(), registered_model_name=f"{catalog_name}.{model_schema}.{model_name}") evaluator = RegressionEvaluator(predictionCol=COL_PRED, labelCol=COL_LABEL) rmse = evaluator.setMetricName("rmse").evaluate(predictions) mlflow.log_metric('rmse', rmse)\ we can also use the ==Feature Store or Feature Engineering APIs== to train and log the models
model_info = fe.log_model(model=model, artifact_path = model_name, flavor=mlflow.spark, training_set=fe_full_data, conda_env=mlflow.spark.get_default_conda_env(), registered_model_name= f"{catalog_name}.{model_schema}.{model_name}" )\ when we use the feature engineering API we can view the model’s lineage in Catalog Explorer

\ Now lets update the model description and assign a Champion label to it.
import time from mlflow.tracking.client import MlflowClient from mlflow.entities.model_registry.model_version_status import ModelVersionStatus client = MlflowClient() #find the latest model version model_name_path = f"{catalog_name}.{model_schema}.{model_name}" model_version_infos = client.search_model_versions(f"name ='{model_name_path}'") new_model_version = max([int(model_version_info.version) for model_version_info in model_version_infos]) #add the model and model version descirption client.update_registered_model( name=model_name_path, description="collaborative filtering using Spark mllib ALS. This model use rating table" ) client.update_model_version( name=model_name_path, version=new_model_version, description="this model is optimized Rank and REG_PARAM with Hyperopt and rmse as a loss function. trained on the full dataset" ) # assign alias client.set_registered_model_alias(model_name_path, "Champion", new_model_version)\ Now go ahead and check the schema that you registered the model. you should see all your updates as follows

:::tip Model stages: If you use workspace for model registry you should stages to manage your models. Using aliases won’t work. Check out ==here== to see how it works
:::
Model Inference Batch ScoringNow imagine we want to use our model in production for inference. In this step we load the champion model and use it to generate 20 movie recommendations for each users.
\
from mlflow.spark import load_model as spark_load_model from mlflow.tracking.client import MlflowClient from create_training_set import split_data #-- set UC as model registray mlflow.set_registry_uri("databricks-uc") #-- initate mlflow client client = MlflowClient() # -- read the config file with open('config.json') as config_file: config = json.load(config_file) catalog_name = config["catalog_name"] gold_layer = config["gold_layer_name"] silver_layer = config["silver_layer_name"] user_item_table_name = config["user_item_table_name"] ft_user_item_name = config["ft_user_item_name"] model_name = config["model_name"] model_schema = config["model_schema"] #-- create the model uri model_path = f"{catalog_name}.{model_schema}.{model_name}" # --create the model_uri: there are two ways to do this # 1: using the alias (we use this*) model_version_uri = f"models:/{model_uri}@champion" # 2: using model version #champion_version = client.get_model_version_by_alias(model_uri, "champion") #model_version_uri = f"models:/{model_uri}/{champion_version.version}" # -- load the model pipline and exctract the model model_pipeline = spark_load_model(model_version_uri) model = model_pipeline.stages[0] # -- batch scoring using the the model fe_full_data, df_full_data, df_train, df_test = split_data() df_batch_input = df_full_data.drop("rating") df_scores = model.transform(df_batch_input) # --- in case you used Feature Engineering to train and register model #from databricks.feature_engineering import FeatureEngineeringClient #fe = FeatureEngineeringClient() # fe.score_batch(model_uri=f"{model_version_uri}",df = df_batch_input)\ and you can see we used the same training data for batch scoring. Although in the case of recommender systems it makes sense, in most application we want use the model to score some unseen data. For example, Imaging your are Netflix and want to update the user recommendations at the end of day based on their new watched list. We can schedule job that run the batch scoring at specific time at the end of the day.
\ Now we can go ahead and generate the recommendations for each user. For this we find the top 20 items per users
from pyspark.sql.window import Window from pyspark.sql.functions import col, split, row_number, collect_list from pyspark.sql.functions import col, collect_list, expr, lit, min, row_number, desc windowSpec = Window.partitionBy("user_id").orderBy(col("prediction").desc()) df_top_20_items = df_scores.withColumn("rank", row_number().over(windowSpec)).filter(col("rank") <= 20) df_user_recs = df_top_20_items.groupBy("user_id") \ .agg(collect_list(col("item_id").cast("double")).alias("top_item_ids"))\ here is how the result look like

Finally we can store the prediction as a delta label on our UC or publish them to a downstream systems Mongo DB or Azure Cosmos DB. We go with the firs option
\
df_user_recs.write.mode("overwrite").saveAsTable(f"{catalog_name}.{output_schema}.top20_item_recommendations")\
Streaming/Online InferenceNow imagine a case in which we want to update our recommendations based on real-time user interactions. For this case we can use model serving. When someone wants to use your model, they can send data to the server. The server then feeds that data to your deployed model, which goes into action, analyzes the data, and generates a prediction. They can be used in web applications, mobile apps, or even embedded systems. One of the application of this approach is to enable traffic routing for A/B testing.
\ ALS algorithm can’t be used directly for online inference since it requires the retraining the model using the whole data (old + new) to update the recommendations. Gradient Descent learning algorithms are examples of model that can be used for online updates. We might look at some of these algorithms in future post.
\ However, just to illustrate how such a model would work, we are creating a (useless) model serving endpoint that predict movie rating based whenever a user rate a movies!
\
import requests model_path = f"{catalog_name}.{model_schema}.{model_name}" champion_version = client.get_model_version_by_alias(model_path, "champion") # Set the name of the MLflow endpoint endpoint_name = config["model_serving_endpoint_name"] # Name of the registered MLflow model model_name = model_path # Specify the type of compute (CPU, GPU_SMALL, GPU_MEDIUM, etc.) workload_type = "CPU" # Specify the scale-out size of compute (Small, Medium, Large, etc.) workload_size = "Small" # Get the latest version of the MLflow model model_version = int(champion_version.version) # Specify Scale to Zero(only supported for CPU endpoints) scale_to_zero = False # Get the API endpoint and token for the current notebook context API_ROOT = dbutils.notebook.entry_point.getDbutils().notebook().getContext().apiUrl().get() API_TOKEN = dbutils.notebook.entry_point.getDbutils().notebook().getContext().apiToken().get() data = { "name": endpoint_name, "config": { "served_models": [ { "model_name": model_name, "model_version": int(model_version), "workload_size": workload_size, "scale_to_zero_enabled": scale_to_zero, "workload_type": workload_type, } ] }, } headers = {"Context-Type": "text/json", "Authorization": f"Bearer {API_TOKEN}"} response = requests.post( url=f"{API_ROOT}/api/2.0/serving-endpoints", json=data, headers=headers )\ This will create and lunch model serving cluster for us so it takes some time. Now if you open the Serving window you should see your endpoint.
\
:::tip we can use one endpoint to serve multiple model. Then we can use traffic routing for scenarios such as A/B testing or compare the performance of difference models in the production.
:::
Inference TableInference tables in Databricks Model Serving act as an automatic log for our deployed models. When enabled, they capture incoming requests (data sent for prediction), the corresponding model outputs (predictions), and some other metadata as a Delta table within Unity Catalog. We can use inference table for monitoring and debugging, lineage tracking, and a data collection procedure for retraining or fine-tune our models.
\ We can enable the inference table on our serving endpoint to monitor the model. We can do it by specifying the auto_capture_config properties in the payload when we first create the endpoint. Or we update our endpoint afterwards using the put command and the config endpoint URL as follows (more ==here)==
\
data = { "served_models": [ { "model_name": model_name, "model_version": int(model_version), "workload_size": workload_size, "scale_to_zero_enabled": scale_to_zero, "workload_type": workload_type, } ], "auto_capture_config":{ "catalog_name": catalog_name, "schema_name": model_schema, "table_name_prefix": payload_table, } } headers = {"Context-Type": "application/json", "Authorization": f"Bearer {API_TOKEN}"} response = requests.put(url=f"{API_ROOT}/api/2.0/serving-endpoints/{endpoint_name}/config", json=data, headers=headers) print(json.dumps(response.json(), indent=4))\ now let’s feed the endpoint with some dummy user interaction data
import random import time all_items = df_full_data.select(col("item_id")).distinct() for user_id in range(50,54): items_not_rated_by_user = df_full_data.where(col("user_id")==user_id).select(col("item_id")).distinct()#collect()[0][0] no_rated_items = [item.item_id for item in all_items.subtract(items_not_rated_by_user).limit(4).collect()] data = { "dataframe_records": [ {"user_id":user_id, "item_id":no_rated_items[0], "rating": random.randint(1, 5)}, {"user_id":user_id, "item_id":no_rated_items[1], "rating": random.randint(1, 5)}, {"user_id":user_id, "item_id":no_rated_items[2], "rating": random.randint(1, 5)}, {"user_id":user_id, "item_id":no_rated_items[2], "rating": random.randint(1, 5)}, ] } response = requests.post( url=f"{API_ROOT}/serving-endpoints/{endpoint_name}/invocations", json=data, headers=headers ) # generate the data within the timespan of 1 to 8 minutes time.sleep(random.randint(60*1, 60*8))\
We can check the endpoint logs in the
\
table_path = f"{catalog_name}.{model_schema}.{payload_table}" # Read data from the inference table df_inf_table = spark.read.table(table_path) display(df_inf_table )\ you should see something like this your payload table

\ To understand the schema of this inference table, check “Unity catalog inference table schema==” here.==
\
Model MonitoringModel and data monitoring a complex topic that requires a lot of time to master. Databricks Lakehouse Monitoring (DLM) reduces the overhead of building a proper monitoring system by providing standard and customizable templates for common use cases. However, mastering DLM and model monitoring in general requires alot of experimentations. I don’t want to give you an extensive overview of model monitoring here but rather give you a starting point. I might dedicate a blog to this topic in future.
\ A short summary of DLM functionalities and features
Now that we have our model up and running, we can use inference table generated by our serving endpoint to monitor key metrics such a model performance and drift to detect any deviations or anomalies in our data or model over time. This proactive approach help us to take timely corrective actions, such as retraining the model or updating its features, to maintain optimal performance and alignment with business objectives.
\
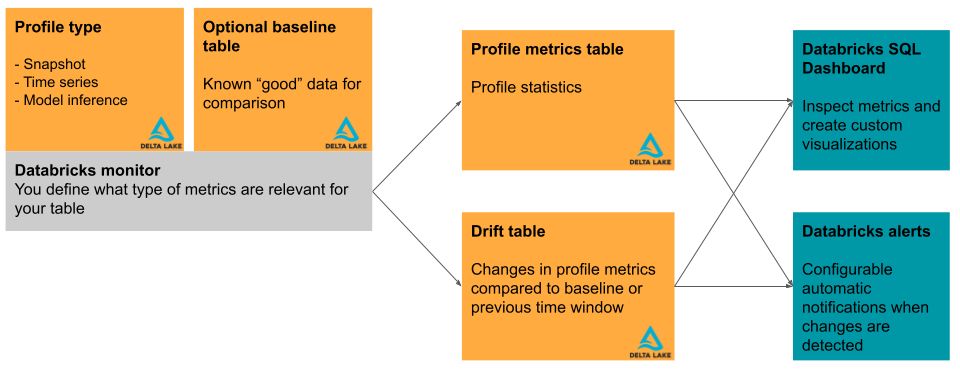
\ DLM provides three type of analysis or profile type: Time Series, Snapshot and Inference. Since we are interested in analyzing our inference table, we focus on the latter one. To use a table for monitoring - our “primary table”, we should make sure that the table have the right structure. For the ==inference table,== each row should correspond to a requests with following columns:
model features
model prediction
model id
timestamp: timestamp of the inference request
ground truth (optional)
\
The model id is important for cases when we serve multiple models and we want to track the performance of each model in one monitoring dashboard. If there are more than one model id available, DLM uses it to slice the data and compute metrics and statics for each slice separately.
\ DLM computes each statistics and metrics for a specified time interval. For inference analysis, it used the timestamp column, plus a user defined window size to identify the time windows. more below.
\ DLM supports two problem type for inference tables: “classification” or “regression”. It computes some of the relevant metrics and statistics based on the this specification.
\ To use DLM, we should create a monitor and attach it to a table. When we do this DLM create two metric tables:
profile metric table: this table contains summary statistics such as min, max, percentage of null and zeros. It also contains additional metrics based on the problem type defined by the user. For example precision, recall and f1score for the classification models, and meansquarederror and meanaverage_error for regression models.
drift metric table: it contains statistic that measure how the distribution of data has changed over time or relative to a baseline value (if provided). It compute measures such as Chi-square test, KS test.
\
to see the list of complete metrics for each table check ==Monitor metric table== documentation page. It is also possible to create ==custom metrics.==
\ An important aspect of building a monitoring system is to make sure that our monitoring dashboard has access to the latest inference data as they arrive. For that we can use ==Delta table streaming== to keep track of processed rows in the inference table. We use the model serving’s inference table as our source table (readStream ), and the monitoring table as the sink table (writeStream). We also make sure the ==Change Data Capture== (CDC) is enabled on both tables (it is enabled by default on the Inference Table). This way we process only changes - insert/update/delete - in the source table rather than re-processing the entire table every refresh.
Hands-onTo enable the monitoring over our inference table we take the following steps:
- Read the inference table as a Streaming table
- Create a new delta table with the right schema by unpacking the inference table that is generated by our model serving endpoint.
- Prepare the baseline table (if any)
- Create a monitor over the resulting table and refresh the metric
- Schedule a workflow to unpack the inference table to the right structure and refresh the metrics
\ First we need to install the Lakehouse Monitoring API. It should be already installed if you use Databricks rum time 15.3 LTS and above:
\
%pip install "https://ml-team-public-read.s3.amazonaws.com/wheels/data-monitoring/a4050ef7-b183-47a1-a145-e614628e3146/databricks_lakehouse_monitoring-0.4.14-py3-none-any.whl" dbutils.library.restartPython()\ Let’s read the inference table as a streaming table
requests_raw = spark.readStream\ .format("delta")\ .table(inference_table_name) requests_raw.isStreaming #-> True\ Next we have to put the table in right format as described above. This table should have one row for each prediction with relevant the features and prediction value. The inference table that we get from the model serving endpoint, store the endpoint requests and responses as a nested JSON format. Here is an example of the JSON payload for the request and response column.
#requests {"dataframe_records": [ {"user_id": 1, "item_id": 346, "rating": 5}, {"user_id": 1, "item_id": 377, "rating": 2}, {"user_id": 1, "item_id": 302, "rating": 4} ] } #reponse {"predictions": [4.248899936676025, 1.1172138452529907, 4.279165744781494] } # --> what we need | user_id | item_id | rating | prediction | |---------|---------|--------|------------| | 1 | 346 | 5 | 4.248900 | | 1 | 377 | 2 | 1.117214 | | 1 | 302 | 4 | 4.279166 |\ To unpack this table to the right schema we can use the following code that is adapted from Databricks documentation ==(Inference table Lakehouse Monitoring starter notebook).==
\
# define the schema of the request and reponse fields in the inference tabel REQUEST_FIELDS = [StructField('user_id', IntegerType(), False),\ StructField('item_id', IntegerType(), False),\ StructField('rating', IntegerType(), False)\ ] RESPONSE_FIELD = [T.StructField("predictions", FloatType())] def process_col_requests(json_str:str) -> str: """ to proccess the JSON payload of request column in inference table """ request = json.loads(json_str) dataframe_records = request.get("dataframe_records", []) return dataframe_records def procces_col_response(json_str: str) -> str: """ to proccess the JSON payload of reponse column in inference table """ reponse = json.loads(json_str) output = [{prediction_col: round(prediction,4)} for prediction in reponse["predictions"]] return output def get_model_id(endpoint_name: str) -> str: """ create the model id by concatinating the model name and the model version. note: the assumption is the endpoint serves only one model """ served_models = get_served_models(endpoint_name) model_id = f"{served_models[0]['model_name']}_{served_models[0]['model_version']}" return model_id def process_requests(requests_raw: DataFrame, request_fields: List[T.StructField], response_field: T.StructField, endpoint_name: str) -> DataFrame: """ Takes a stream of raw requests and processes them by: - Unpacking JSON payloads for requests and responses - Exploding batched requests into individual rows - Converting Unix epoch millisecond timestamps to be Spark TimestampType :param requests_raw: DataFrame containing raw requests. Assumed to contain the following columns: - `request` - `response` - `timestamp_ms` :param request_fields: List of StructFields representing the request schema :param response_field: A StructField representing the response schema :return: A DataFrame containing processed requests """ # Convert the timestamp milliseconds to TimestampType for downstream processing. requests_timestamped = requests_raw \ .withColumn(timestamp_col, (F.col("timestamp_ms") / 1000).cast(T.TimestampType())) \ .drop("timestamp_ms") # create the model identifier column model_id = get_model_id(endpoint_name) # Convert the model name and version columns into a model identifier column. requests_identified = requests_timestamped \ .withColumn(model_id_col, F.lit(model_id)) # Rename the date column to avoid collisions with features. requests_dated = requests_identified.withColumnRenamed("date", date_col) # Consolidate and unpack JSON. request_schema = T.ArrayType(T.StructType(request_fields)) response_schema = T.ArrayType(T.StructType(response_field)) # w udf_request = F.udf(process_col_requests, request_schema) udf_reponse = F.udf(procces_col_response, response_schema) requests_unpacked = requests_dated.withColumn("request", udf_request("request")).\ withColumn("response", udf_reponse("response")) # Explode batched requests into individual rows. DB_PREFIX = "__db" requests_exploded = requests_unpacked \ .withColumn(f"{DB_PREFIX}_request_response", F.arrays_zip(F.col("request"), F.col("response"))) \ .withColumn(f"{DB_PREFIX}_request_response", F.explode(F.col(f"{DB_PREFIX}_request_response"))) \ .select(F.col("*"), F.col(f"{DB_PREFIX}_request_response.request.*"), F.col(f"{DB_PREFIX}_request_response.response.*")) \ .drop(f"{DB_PREFIX}_request_response", "request", "response") requests_cleaned = requests_exploded.drop("status_code", "sampling_fraction", "client_request_id", "databricks_request_id", "request_metadata") return requests_cleaned\ The resulting table would look like this:
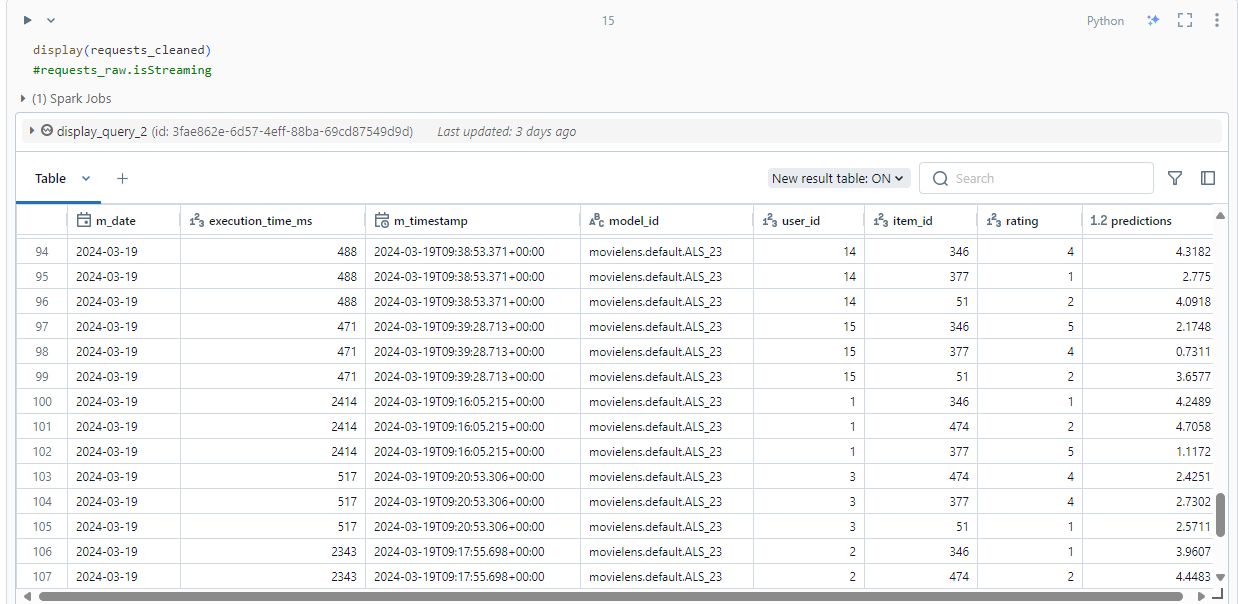
Next we should initialize our sink table
dt_builder = DeltaTable.createIfNotExists(spark) \ .tableName(unpacked_requests_table_name) \ .addColumns(schema) \ .partitionedBy(requests_cleaned.schema) \ .property("delta.enableChangeDataFeed", "true") \ dt_builder.execute()\ and write the results
checkpoint_path = f"dbfs:/payload-logging/{endpoint_name}/checkpoint" requests_stream = requests_cleaned.writeStream \ .trigger(once=True) \ .format("delta") \ .partitionBy(date_col) \ .outputMode("append") \ .option("checkpointLocation", checkpoint_path) \ .toTable(unpacked_requests_table_name) \\ Finally, we create our baseline table. DLM uses this table to compute the drifts by comparing the distribution of similar columns of baseline and primary models. The baseline table should have the same feature column as the primary column as well as the same model identification column. For baseline table we use the prediction table of our validation dataset that we store earlier after we trained our model using he best hyperparameter. To compute the drift metric, Databricks compute the profile metrics for both primary and the baseline table. Here you can read about the ==Primary table and baseline table.==
\
#read the prediction table df_base_table = spark.table(f"{catalog_name}.{model_schema}.predictions") # create the model id and add it to the table model_id = get_model_id(endpoint_name) df_base_table = df_base_table.withColumn(model_id_col, F.lit(model_id)) #write the new table and enable the CDC on it output_base_table_name = f"{catalog_name}.{model_schema}.{base_table_prefix}_{model_name}" df_base_table.write.format("delta").mode("overwrite").saveAsTable(output_base_table_name) spark.sql(f"ALTER TABLE {output_base_table_name} SET TBLPROPERTIES (delta.enableChangeDataFeed = true)")\ Now we are read to create our monitoring dashboard. We can do it either using the ==UI== or the Lakehouse Monitoring API. Here we use the second option:
# This is where we store the metric tables. output_schema_name = f"{catalog_name}.{model_schema}" try: info = lm.create_monitor( table_name=unpacked_requests_table_name, profile_type=lm.InferenceLog( timestamp_col=timestamp_col, granularities=granularities,#the aggregation window model_id_col=model_id_col, prediction_col=prediction_col, label_col=label_col, problem_type=problem_type, ), output_schema_name=output_schema_name, schedule=None, # We will refresh the metrics on-demand in this notebook baseline_table_name=output_base_table_name, ) print(info) except Exception as e: # Ensure the exception was expected assert "RESOURCE_ALREADY_EXISTS" in str(e), f"Unexpected error: {e}" # Update the monitor if any parameters of this notebook have changed. lm.update_monitor( table_name=unpacked_requests_table_name, updated_params=dict( profile_type=lm.InferenceLog( timestamp_col=timestamp_col, granularities=granularities, model_id_col=model_id_col, prediction_col=prediction_col, label_col=label_col, problem_type=problem_type, ), output_schema_name=output_schema_name, schedule=None, baseline_table_name=output_base_table_name, ) ) # Refresh metrics calculated on the requests table. refresh_info = lm.run_refresh(table_name=unpacked_requests_table_name) print(refresh_info)\ after we run the code it takes some time until Databricks calculate all the metric. To see the dashboard go to the Quality tab of your sink table (i.e. unpacked_requests_table_name). You should see a page as follow.
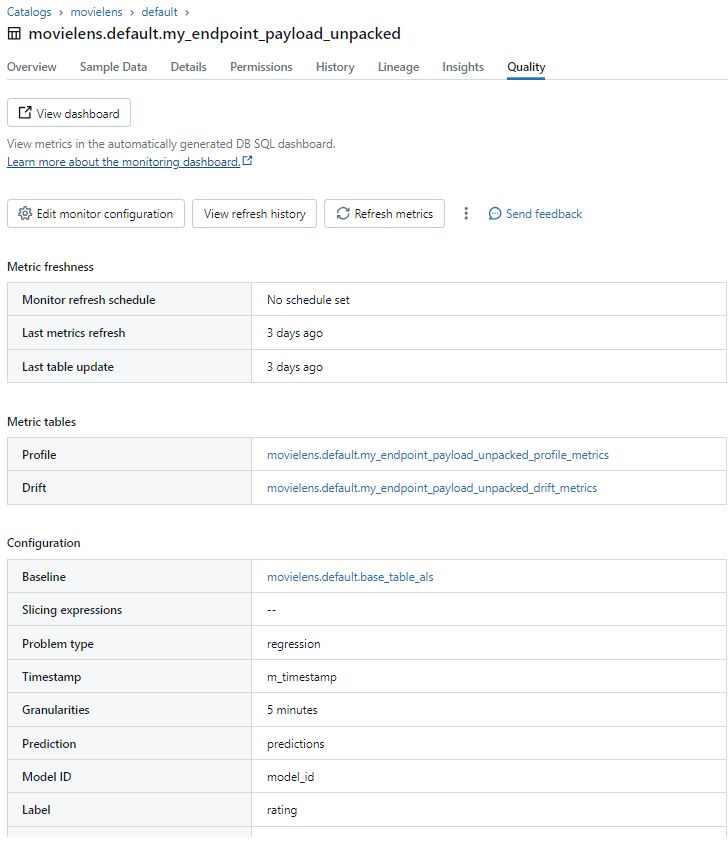
\ If you click on the view refresh history you see your running, pending and past refreshes. click on the View Dashboard to open your dashboard.
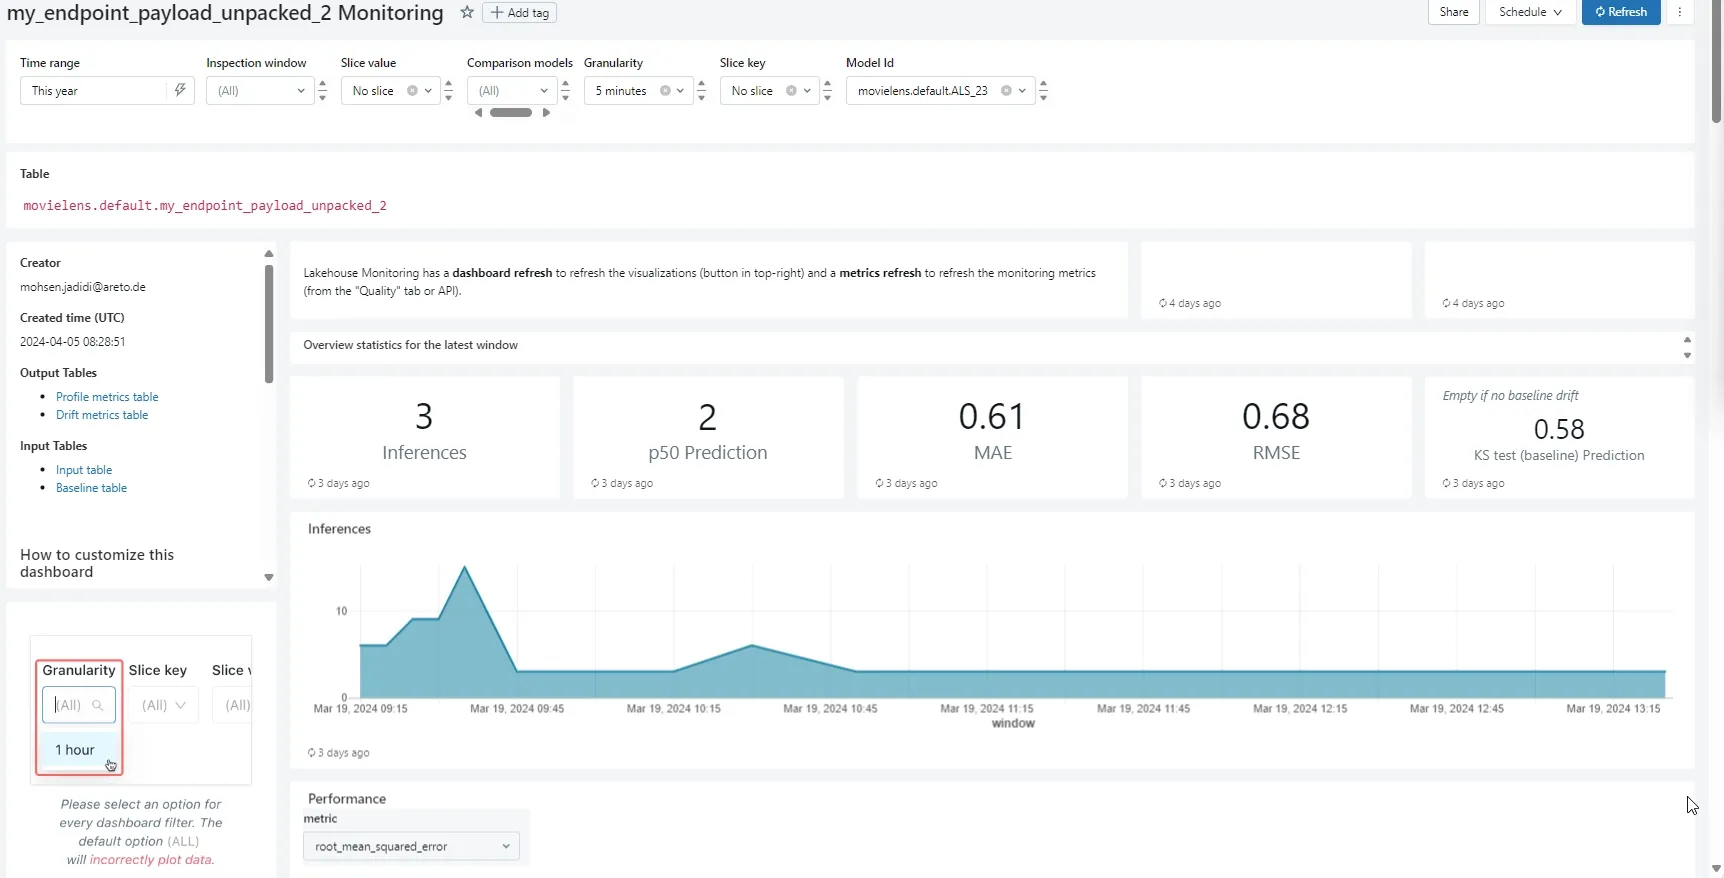
\ \ so we start with the inference table (my_endpoint_payload ), process it and save the result to my_endpoint_payload_unpacked and pass this table along with our baseline table (base_table_als) to our monitoring API. The DLM compute the profile metrics for each table (my_endpoint_payload_unpacked_profile_metric ) and use the them to compute the drift metrics (my_endpoint_payload_unpacked_drift_metrics)
\ There you go! you have everything you need to serve and monitor you model!
\ In the next part I’ll show you how to automate this process using Databricks Assets Bundle and Gitlab!
In the ==first part of this tutorial== series, we took the first steps for building an end-to-end MLOps pipeline using Databricks and Spark, guided by Databricks' reference architecture. Here's a recap of the key steps we covered:
\
Setting Up the Unity Catalog for Medallion Architecture: We organized our data into bronze, silver, and gold layers within the Unity Catalog, establishing a structured and efficient data management system.
Ingesting Data into Unity Catalog: We demonstrated how to import raw data into the system, ensuring consistency and quality for subsequent processing stages.
Training the Model: Utilizing Databricks, we trained a machine learning model tailored to our dataset, following best practices for scalable and effective model development.
Hyperparameter Tuning with HyperOpt: To enhance model performance, we employed HyperOpt to automate the search for optimal hyperparameters, improving accuracy and efficiency.
Experiment Tracking with Databricks MLflow: We utilized MLflow to log and monitor our experiments, maintaining a comprehensive record of model versions, metrics, and parameters for easy comparison and reproducibility.
\
With these foundational steps completed, your model is now primed for deployment. In this second part, we'll focus on integrating two critical components into our system:
\
- Batch Inference: Implementing batch processing to generate predictions on large datasets, suitable for applications like bulk scoring and periodic reporting.
- Online Inference (Model Serving): Setting up real-time model serving to provide immediate predictions, essential for interactive applications and services.
- Model Monitoring: to ensure your deployed models maintain optimal performance and reliability over time.
\ Let's get into it!
Model DeploymentThe departure point of the last blog was model evaluation. Now imagine we did the comparison and found that our model shows a higher performance compare to this production model. As we want (assume) to use the model in production, we want to take advantage of all the data that we have. The next step is to train and test the model using the full dataset. Then persist our model for later use by deploying it as our champion model. Since this is the final model that we want to use for inference, we use the Feature Engineering client to train the model. This way we are not only track the model lineage easier, but also offload the schema validation and feature transformation (if any) to the client.
\
with mlflow.start_run(run_name="ALS_best_model") as run: als = ALS() # Now we set the parameters for the method als.setMaxIter(MAX_ITER)\ .setSeed(SEED)\ .setRegParam(best_params["REG_PARAM"])\ .setUserCol(COL_USER)\ .setItemCol(COL_ITEM)\ .setRatingCol(COL_LABEL)\ .setRank(best_params["RANK"]) mlflow.log_param("MAX_ITER", MAX_ITER) mlflow.log_param("RANK", best_params["RANK"]) mlflow.log_param("REG_PARAM", best_params["REG_PARAM"]) # Create the model with these parameters. model = als.fit(df_full_data) #drop predictions where users and products from the test test and didn't make it into the training set. in this case, the prediction is NaN model.setColdStartStrategy('drop') predictions = model.transform(df_full_data) signature = infer_signature(model_input = df_full_data, model_output = predictions.select(COL_LABEL)) #log the model mlflow.spark.log_model(model, model_name, sample_input=df_full_data.limit(3), signature = signature, conda_env=mlflow.spark.get_default_conda_env(), registered_model_name=f"{catalog_name}.{model_schema}.{model_name}") evaluator = RegressionEvaluator(predictionCol=COL_PRED, labelCol=COL_LABEL) rmse = evaluator.setMetricName("rmse").evaluate(predictions) mlflow.log_metric('rmse', rmse)\ we can also use the ==Feature Store or Feature Engineering APIs== to train and log the models
model_info = fe.log_model(model=model, artifact_path = model_name, flavor=mlflow.spark, training_set=fe_full_data, conda_env=mlflow.spark.get_default_conda_env(), registered_model_name= f"{catalog_name}.{model_schema}.{model_name}" )\ when we use the feature engineering API we can view the model’s lineage in Catalog Explorer

\ Now lets update the model description and assign a Champion label to it.
import time from mlflow.tracking.client import MlflowClient from mlflow.entities.model_registry.model_version_status import ModelVersionStatus client = MlflowClient() #find the latest model version model_name_path = f"{catalog_name}.{model_schema}.{model_name}" model_version_infos = client.search_model_versions(f"name ='{model_name_path}'") new_model_version = max([int(model_version_info.version) for model_version_info in model_version_infos]) #add the model and model version descirption client.update_registered_model( name=model_name_path, description="collaborative filtering using Spark mllib ALS. This model use rating table" ) client.update_model_version( name=model_name_path, version=new_model_version, description="this model is optimized Rank and REG_PARAM with Hyperopt and rmse as a loss function. trained on the full dataset" ) # assign alias client.set_registered_model_alias(model_name_path, "Champion", new_model_version)\ Now go ahead and check the schema that you registered the model. you should see all your updates as follows

:::tip Model stages: If you use workspace for model registry you should stages to manage your models. Using aliases won’t work. Check out ==here== to see how it works
:::
Model Inference Batch ScoringNow imagine we want to use our model in production for inference. In this step we load the champion model and use it to generate 20 movie recommendations for each users.
\
from mlflow.spark import load_model as spark_load_model from mlflow.tracking.client import MlflowClient from create_training_set import split_data #-- set UC as model registray mlflow.set_registry_uri("databricks-uc") #-- initate mlflow client client = MlflowClient() # -- read the config file with open('config.json') as config_file: config = json.load(config_file) catalog_name = config["catalog_name"] gold_layer = config["gold_layer_name"] silver_layer = config["silver_layer_name"] user_item_table_name = config["user_item_table_name"] ft_user_item_name = config["ft_user_item_name"] model_name = config["model_name"] model_schema = config["model_schema"] #-- create the model uri model_path = f"{catalog_name}.{model_schema}.{model_name}" # --create the model_uri: there are two ways to do this # 1: using the alias (we use this*) model_version_uri = f"models:/{model_uri}@champion" # 2: using model version #champion_version = client.get_model_version_by_alias(model_uri, "champion") #model_version_uri = f"models:/{model_uri}/{champion_version.version}" # -- load the model pipline and exctract the model model_pipeline = spark_load_model(model_version_uri) model = model_pipeline.stages[0] # -- batch scoring using the the model fe_full_data, df_full_data, df_train, df_test = split_data() df_batch_input = df_full_data.drop("rating") df_scores = model.transform(df_batch_input) # --- in case you used Feature Engineering to train and register model #from databricks.feature_engineering import FeatureEngineeringClient #fe = FeatureEngineeringClient() # fe.score_batch(model_uri=f"{model_version_uri}",df = df_batch_input)\ and you can see we used the same training data for batch scoring. Although in the case of recommender systems it makes sense, in most application we want use the model to score some unseen data. For example, Imaging your are Netflix and want to update the user recommendations at the end of day based on their new watched list. We can schedule job that run the batch scoring at specific time at the end of the day.
\ Now we can go ahead and generate the recommendations for each user. For this we find the top 20 items per users
from pyspark.sql.window import Window from pyspark.sql.functions import col, split, row_number, collect_list from pyspark.sql.functions import col, collect_list, expr, lit, min, row_number, desc windowSpec = Window.partitionBy("user_id").orderBy(col("prediction").desc()) df_top_20_items = df_scores.withColumn("rank", row_number().over(windowSpec)).filter(col("rank") <= 20) df_user_recs = df_top_20_items.groupBy("user_id") \ .agg(collect_list(col("item_id").cast("double")).alias("top_item_ids"))\ here is how the result look like

Finally we can store the prediction as a delta label on our UC or publish them to a downstream systems Mongo DB or Azure Cosmos DB. We go with the firs option
\
df_user_recs.write.mode("overwrite").saveAsTable(f"{catalog_name}.{output_schema}.top20_item_recommendations")\
Streaming/Online InferenceNow imagine a case in which we want to update our recommendations based on real-time user interactions. For this case we can use model serving. When someone wants to use your model, they can send data to the server. The server then feeds that data to your deployed model, which goes into action, analyzes the data, and generates a prediction. They can be used in web applications, mobile apps, or even embedded systems. One of the application of this approach is to enable traffic routing for A/B testing.
\ ALS algorithm can’t be used directly for online inference since it requires the retraining the model using the whole data (old + new) to update the recommendations. Gradient Descent learning algorithms are examples of model that can be used for online updates. We might look at some of these algorithms in future post.
\ However, just to illustrate how such a model would work, we are creating a (useless) model serving endpoint that predict movie rating based whenever a user rate a movies!
\
import requests model_path = f"{catalog_name}.{model_schema}.{model_name}" champion_version = client.get_model_version_by_alias(model_path, "champion") # Set the name of the MLflow endpoint endpoint_name = config["model_serving_endpoint_name"] # Name of the registered MLflow model model_name = model_path # Specify the type of compute (CPU, GPU_SMALL, GPU_MEDIUM, etc.) workload_type = "CPU" # Specify the scale-out size of compute (Small, Medium, Large, etc.) workload_size = "Small" # Get the latest version of the MLflow model model_version = int(champion_version.version) # Specify Scale to Zero(only supported for CPU endpoints) scale_to_zero = False # Get the API endpoint and token for the current notebook context API_ROOT = dbutils.notebook.entry_point.getDbutils().notebook().getContext().apiUrl().get() API_TOKEN = dbutils.notebook.entry_point.getDbutils().notebook().getContext().apiToken().get() data = { "name": endpoint_name, "config": { "served_models": [ { "model_name": model_name, "model_version": int(model_version), "workload_size": workload_size, "scale_to_zero_enabled": scale_to_zero, "workload_type": workload_type, } ] }, } headers = {"Context-Type": "text/json", "Authorization": f"Bearer {API_TOKEN}"} response = requests.post( url=f"{API_ROOT}/api/2.0/serving-endpoints", json=data, headers=headers )\ This will create and lunch model serving cluster for us so it takes some time. Now if you open the Serving window you should see your endpoint.
\
:::tip we can use one endpoint to serve multiple model. Then we can use traffic routing for scenarios such as A/B testing or compare the performance of difference models in the production.
:::
Inference TableInference tables in Databricks Model Serving act as an automatic log for our deployed models. When enabled, they capture incoming requests (data sent for prediction), the corresponding model outputs (predictions), and some other metadata as a Delta table within Unity Catalog. We can use inference table for monitoring and debugging, lineage tracking, and a data collection procedure for retraining or fine-tune our models.
\ We can enable the inference table on our serving endpoint to monitor the model. We can do it by specifying the auto_capture_config properties in the payload when we first create the endpoint. Or we update our endpoint afterwards using the put command and the config endpoint URL as follows (more ==here)==
\
data = { "served_models": [ { "model_name": model_name, "model_version": int(model_version), "workload_size": workload_size, "scale_to_zero_enabled": scale_to_zero, "workload_type": workload_type, } ], "auto_capture_config":{ "catalog_name": catalog_name, "schema_name": model_schema, "table_name_prefix": payload_table, } } headers = {"Context-Type": "application/json", "Authorization": f"Bearer {API_TOKEN}"} response = requests.put(url=f"{API_ROOT}/api/2.0/serving-endpoints/{endpoint_name}/config", json=data, headers=headers) print(json.dumps(response.json(), indent=4))\ now let’s feed the endpoint with some dummy user interaction data
import random import time all_items = df_full_data.select(col("item_id")).distinct() for user_id in range(50,54): items_not_rated_by_user = df_full_data.where(col("user_id")==user_id).select(col("item_id")).distinct()#collect()[0][0] no_rated_items = [item.item_id for item in all_items.subtract(items_not_rated_by_user).limit(4).collect()] data = { "dataframe_records": [ {"user_id":user_id, "item_id":no_rated_items[0], "rating": random.randint(1, 5)}, {"user_id":user_id, "item_id":no_rated_items[1], "rating": random.randint(1, 5)}, {"user_id":user_id, "item_id":no_rated_items[2], "rating": random.randint(1, 5)}, {"user_id":user_id, "item_id":no_rated_items[2], "rating": random.randint(1, 5)}, ] } response = requests.post( url=f"{API_ROOT}/serving-endpoints/{endpoint_name}/invocations", json=data, headers=headers ) # generate the data within the timespan of 1 to 8 minutes time.sleep(random.randint(60*1, 60*8))\
We can check the endpoint logs in the
\
table_path = f"{catalog_name}.{model_schema}.{payload_table}" # Read data from the inference table df_inf_table = spark.read.table(table_path) display(df_inf_table )\ you should see something like this your payload table

\ To understand the schema of this inference table, check “Unity catalog inference table schema==” here.==
\
Model MonitoringModel and data monitoring a complex topic that requires a lot of time to master. Databricks Lakehouse Monitoring (DLM) reduces the overhead of building a proper monitoring system by providing standard and customizable templates for common use cases. However, mastering DLM and model monitoring in general requires alot of experimentations. I don’t want to give you an extensive overview of model monitoring here but rather give you a starting point. I might dedicate a blog to this topic in future.
\ A short summary of DLM functionalities and features
Now that we have our model up and running, we can use inference table generated by our serving endpoint to monitor key metrics such a model performance and drift to detect any deviations or anomalies in our data or model over time. This proactive approach help us to take timely corrective actions, such as retraining the model or updating its features, to maintain optimal performance and alignment with business objectives.
\

\ DLM provides three type of analysis or profile type: Time Series, Snapshot and Inference. Since we are interested in analyzing our inference table, we focus on the latter one. To use a table for monitoring - our “primary table”, we should make sure that the table have the right structure. For the ==inference table,== each row should correspond to a requests with following columns:
model features
model prediction
model id
timestamp: timestamp of the inference request
ground truth (optional)
\
The model id is important for cases when we serve multiple models and we want to track the performance of each model in one monitoring dashboard. If there are more than one model id available, DLM uses it to slice the data and compute metrics and statics for each slice separately.
\ DLM computes each statistics and metrics for a specified time interval. For inference analysis, it used the timestamp column, plus a user defined window size to identify the time windows. more below.
\ DLM supports two problem type for inference tables: “classification” or “regression”. It computes some of the relevant metrics and statistics based on the this specification.
\ To use DLM, we should create a monitor and attach it to a table. When we do this DLM create two metric tables:
profile metric table: this table contains summary statistics such as min, max, percentage of null and zeros. It also contains additional metrics based on the problem type defined by the user. For example precision, recall and f1score for the classification models, and meansquarederror and meanaverage_error for regression models.
drift metric table: it contains statistic that measure how the distribution of data has changed over time or relative to a baseline value (if provided). It compute measures such as Chi-square test, KS test.
\
to see the list of complete metrics for each table check ==Monitor metric table== documentation page. It is also possible to create ==custom metrics.==
\ An important aspect of building a monitoring system is to make sure that our monitoring dashboard has access to the latest inference data as they arrive. For that we can use ==Delta table streaming== to keep track of processed rows in the inference table. We use the model serving’s inference table as our source table (readStream ), and the monitoring table as the sink table (writeStream). We also make sure the ==Change Data Capture== (CDC) is enabled on both tables (it is enabled by default on the Inference Table). This way we process only changes - insert/update/delete - in the source table rather than re-processing the entire table every refresh.
Hands-onTo enable the monitoring over our inference table we take the following steps:
- Read the inference table as a Streaming table
- Create a new delta table with the right schema by unpacking the inference table that is generated by our model serving endpoint.
- Prepare the baseline table (if any)
- Create a monitor over the resulting table and refresh the metric
- Schedule a workflow to unpack the inference table to the right structure and refresh the metrics
\ First we need to install the Lakehouse Monitoring API. It should be already installed if you use Databricks rum time 15.3 LTS and above:
\
%pip install "https://ml-team-public-read.s3.amazonaws.com/wheels/data-monitoring/a4050ef7-b183-47a1-a145-e614628e3146/databricks_lakehouse_monitoring-0.4.14-py3-none-any.whl" dbutils.library.restartPython()\ Let’s read the inference table as a streaming table
requests_raw = spark.readStream\ .format("delta")\ .table(inference_table_name) requests_raw.isStreaming #-> True\ Next we have to put the table in right format as described above. This table should have one row for each prediction with relevant the features and prediction value. The inference table that we get from the model serving endpoint, store the endpoint requests and responses as a nested JSON format. Here is an example of the JSON payload for the request and response column.
#requests {"dataframe_records": [ {"user_id": 1, "item_id": 346, "rating": 5}, {"user_id": 1, "item_id": 377, "rating": 2}, {"user_id": 1, "item_id": 302, "rating": 4} ] } #reponse {"predictions": [4.248899936676025, 1.1172138452529907, 4.279165744781494] } # --> what we need | user_id | item_id | rating | prediction | |---------|---------|--------|------------| | 1 | 346 | 5 | 4.248900 | | 1 | 377 | 2 | 1.117214 | | 1 | 302 | 4 | 4.279166 |\ To unpack this table to the right schema we can use the following code that is adapted from Databricks documentation ==(Inference table Lakehouse Monitoring starter notebook).==
\
# define the schema of the request and reponse fields in the inference tabel REQUEST_FIELDS = [StructField('user_id', IntegerType(), False),\ StructField('item_id', IntegerType(), False),\ StructField('rating', IntegerType(), False)\ ] RESPONSE_FIELD = [T.StructField("predictions", FloatType())] def process_col_requests(json_str:str) -> str: """ to proccess the JSON payload of request column in inference table """ request = json.loads(json_str) dataframe_records = request.get("dataframe_records", []) return dataframe_records def procces_col_response(json_str: str) -> str: """ to proccess the JSON payload of reponse column in inference table """ reponse = json.loads(json_str) output = [{prediction_col: round(prediction,4)} for prediction in reponse["predictions"]] return output def get_model_id(endpoint_name: str) -> str: """ create the model id by concatinating the model name and the model version. note: the assumption is the endpoint serves only one model """ served_models = get_served_models(endpoint_name) model_id = f"{served_models[0]['model_name']}_{served_models[0]['model_version']}" return model_id def process_requests(requests_raw: DataFrame, request_fields: List[T.StructField], response_field: T.StructField, endpoint_name: str) -> DataFrame: """ Takes a stream of raw requests and processes them by: - Unpacking JSON payloads for requests and responses - Exploding batched requests into individual rows - Converting Unix epoch millisecond timestamps to be Spark TimestampType :param requests_raw: DataFrame containing raw requests. Assumed to contain the following columns: - `request` - `response` - `timestamp_ms` :param request_fields: List of StructFields representing the request schema :param response_field: A StructField representing the response schema :return: A DataFrame containing processed requests """ # Convert the timestamp milliseconds to TimestampType for downstream processing. requests_timestamped = requests_raw \ .withColumn(timestamp_col, (F.col("timestamp_ms") / 1000).cast(T.TimestampType())) \ .drop("timestamp_ms") # create the model identifier column model_id = get_model_id(endpoint_name) # Convert the model name and version columns into a model identifier column. requests_identified = requests_timestamped \ .withColumn(model_id_col, F.lit(model_id)) # Rename the date column to avoid collisions with features. requests_dated = requests_identified.withColumnRenamed("date", date_col) # Consolidate and unpack JSON. request_schema = T.ArrayType(T.StructType(request_fields)) response_schema = T.ArrayType(T.StructType(response_field)) # w udf_request = F.udf(process_col_requests, request_schema) udf_reponse = F.udf(procces_col_response, response_schema) requests_unpacked = requests_dated.withColumn("request", udf_request("request")).\ withColumn("response", udf_reponse("response")) # Explode batched requests into individual rows. DB_PREFIX = "__db" requests_exploded = requests_unpacked \ .withColumn(f"{DB_PREFIX}_request_response", F.arrays_zip(F.col("request"), F.col("response"))) \ .withColumn(f"{DB_PREFIX}_request_response", F.explode(F.col(f"{DB_PREFIX}_request_response"))) \ .select(F.col("*"), F.col(f"{DB_PREFIX}_request_response.request.*"), F.col(f"{DB_PREFIX}_request_response.response.*")) \ .drop(f"{DB_PREFIX}_request_response", "request", "response") requests_cleaned = requests_exploded.drop("status_code", "sampling_fraction", "client_request_id", "databricks_request_id", "request_metadata") return requests_cleaned\ The resulting table would look like this:

Next we should initialize our sink table
dt_builder = DeltaTable.createIfNotExists(spark) \ .tableName(unpacked_requests_table_name) \ .addColumns(schema) \ .partitionedBy(requests_cleaned.schema) \ .property("delta.enableChangeDataFeed", "true") \ dt_builder.execute()\ and write the results
checkpoint_path = f"dbfs:/payload-logging/{endpoint_name}/checkpoint" requests_stream = requests_cleaned.writeStream \ .trigger(once=True) \ .format("delta") \ .partitionBy(date_col) \ .outputMode("append") \ .option("checkpointLocation", checkpoint_path) \ .toTable(unpacked_requests_table_name) \\ Finally, we create our baseline table. DLM uses this table to compute the drifts by comparing the distribution of similar columns of baseline and primary models. The baseline table should have the same feature column as the primary column as well as the same model identification column. For baseline table we use the prediction table of our validation dataset that we store earlier after we trained our model using he best hyperparameter. To compute the drift metric, Databricks compute the profile metrics for both primary and the baseline table. Here you can read about the ==Primary table and baseline table.==
\
#read the prediction table df_base_table = spark.table(f"{catalog_name}.{model_schema}.predictions") # create the model id and add it to the table model_id = get_model_id(endpoint_name) df_base_table = df_base_table.withColumn(model_id_col, F.lit(model_id)) #write the new table and enable the CDC on it output_base_table_name = f"{catalog_name}.{model_schema}.{base_table_prefix}_{model_name}" df_base_table.write.format("delta").mode("overwrite").saveAsTable(output_base_table_name) spark.sql(f"ALTER TABLE {output_base_table_name} SET TBLPROPERTIES (delta.enableChangeDataFeed = true)")\ Now we are read to create our monitoring dashboard. We can do it either using the ==UI== or the Lakehouse Monitoring API. Here we use the second option:
# This is where we store the metric tables. output_schema_name = f"{catalog_name}.{model_schema}" try: info = lm.create_monitor( table_name=unpacked_requests_table_name, profile_type=lm.InferenceLog( timestamp_col=timestamp_col, granularities=granularities,#the aggregation window model_id_col=model_id_col, prediction_col=prediction_col, label_col=label_col, problem_type=problem_type, ), output_schema_name=output_schema_name, schedule=None, # We will refresh the metrics on-demand in this notebook baseline_table_name=output_base_table_name, ) print(info) except Exception as e: # Ensure the exception was expected assert "RESOURCE_ALREADY_EXISTS" in str(e), f"Unexpected error: {e}" # Update the monitor if any parameters of this notebook have changed. lm.update_monitor( table_name=unpacked_requests_table_name, updated_params=dict( profile_type=lm.InferenceLog( timestamp_col=timestamp_col, granularities=granularities, model_id_col=model_id_col, prediction_col=prediction_col, label_col=label_col, problem_type=problem_type, ), output_schema_name=output_schema_name, schedule=None, baseline_table_name=output_base_table_name, ) ) # Refresh metrics calculated on the requests table. refresh_info = lm.run_refresh(table_name=unpacked_requests_table_name) print(refresh_info)\ after we run the code it takes some time until Databricks calculate all the metric. To see the dashboard go to the Quality tab of your sink table (i.e. unpacked_requests_table_name). You should see a page as follow.

\ If you click on the view refresh history you see your running, pending and past refreshes. click on the View Dashboard to open your dashboard.

\ \ so we start with the inference table (my_endpoint_payload ), process it and save the result to my_endpoint_payload_unpacked and pass this table along with our baseline table (base_table_als) to our monitoring API. The DLM compute the profile metrics for each table (my_endpoint_payload_unpacked_profile_metric ) and use the them to compute the drift metrics (my_endpoint_payload_unpacked_drift_metrics)
\ There you go! you have everything you need to serve and monitor you model!
\ In the next part I’ll show you how to automate this process using Databricks Assets Bundle and Gitlab!
- Home
- About Us
- Write For Us / Submit Content
- Advertising And Affiliates
- Feeds And Syndication
- Contact Us
- Login
- Privacy
All Rights Reserved. Copyright , Central Coast Communications, Inc.