and the distribution of digital products.
DM Television
Solana Next Move: SOL Heading towards $300 ?
Solana combines the Proof-of-History (PoH) protocol with Proof-of-Stake (PoS) consensus, allowing it to process over 65,000 transactions per second.
Solana’s unique blend of high-speed transactions and efficient Proof-of-History (PoH) protocol continues to position it as a leading blockchain platform.
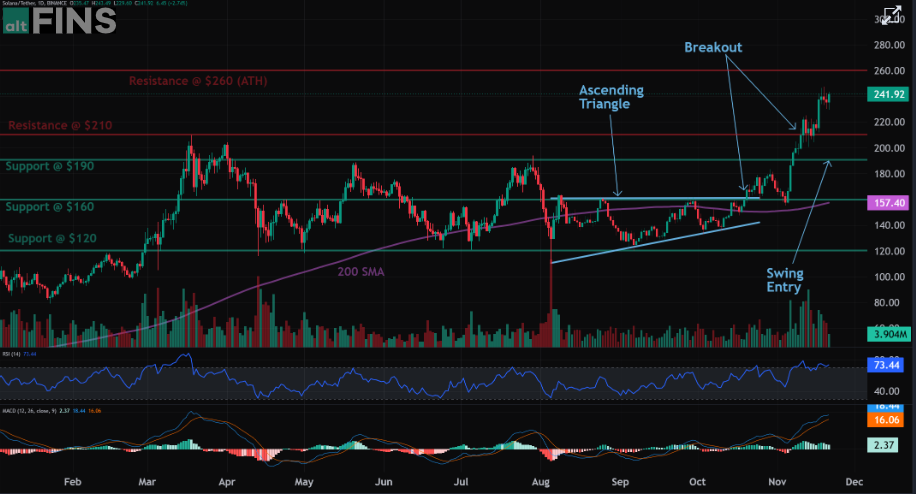
Price is Approaching Resistance, which is a level where it could pause or reverse its recent advance, at least temporarily. Resistance is often a level where price got rejected in the past, or potentially prior Support level that was broken. Once price breaks above resistance, it can advance higher to the next resistance level.
For on-demand analysis of any cryptocurrency, join our Telegram channel.
Solana Next Price Target- Current Price: $258.36
- Market Cap: Approximately $121 billion
- 24-Hour Trading Volume: $8.96 billion
- Circulating Supply: 470 million SOL
- Total Supply: 489 million SOL
 Img src- Altfins
Following a breakout from Ascending Triangle, above the triangle resistance of $160, price has rallied above $240 for +50% gain. It’s now approaching its ATH at $260. Now we look for the right entry opportunity in Uptrend.
We wait for price to pull back near $190 support for another swing trade entry in Uptrend with upside potential back to $260.
Buy Now Weekly Price AnalysisOver the past week, Solana has shown resilience with a 17.6% price increase, despite a slight 0.6% dip in the last 24 hours.
Trend: Short-term trend is Strong Up, Medium-term trend is Strong Up, Long-term trend is Strong Up.
Momentum is Bullish ( MACD Line crossed above MACD Signal Line) ABOVE days ago. Price is Overbought currently.
Support and Resistance: Nearest Support Zone is $160.00, then $120.00. Nearest Resistance Zone is $260.00.
Key Indicators- Fear & Greed Index: Slightly tilted towards optimism.
- 50-Day SMA: Bullish, indicating continued positive sentiment.
- 14-Day RSI: Overbought territory.
- CFTC Subcommittee Backs Tokenized Collateral in Derivatives
- South Korea’s Delio Declared Bankrupt, $1.75 Billion in Debt
For on-demand analysis of any cryptocurrency, join our Telegram channel.
- Home
- About Us
- Write For Us / Submit Content
- Advertising And Affiliates
- Feeds And Syndication
- Contact Us
- Login
- Privacy
All Rights Reserved. Copyright , Central Coast Communications, Inc.