and the distribution of digital products.
DM Television
Efficient Detection of Defects in Magnetic Labyrinthine Patterns: Experiments and Results
:::info Authors:
(1) Vinicius Yu Okubo, B.S. in electrical engineering from the University of São Paulo in 2022 and currently, he is pursuing his M.S. in electrical engineering at the University of São Paulo;
(2) Kotaro Shimizu, B.S. degree in Physics from Waseda University, Japan, in 2019 and M.S. degree in Physics from the University of Tokyo, Japan, 2021 and He has been pursuing his Ph.D. in Physics as a JSPS research fellowship for young scientists in the University of Tokyo since 2021;
(3) B.S. Shivaram, received his B.S. degree in Physics, Chemistry and Mathematics from Bangalore University, India, in 1977 and the M.S. degree in Physics from the Indian Institute of Technology, Madras, India, in 1979 and his Ph.D. in experimental condensed matter physics from Northwestern University, Evanston, Illinois in 1984;
(4) Hae Yong Kim, He received the B.S. and M.S. degrees (with distinctions) in computer science and the Ph.D. degree in electrical engineering from the Universidade de São Paulo (USP), Brazil, in 1988, 1992 and 1997, respectively.
:::
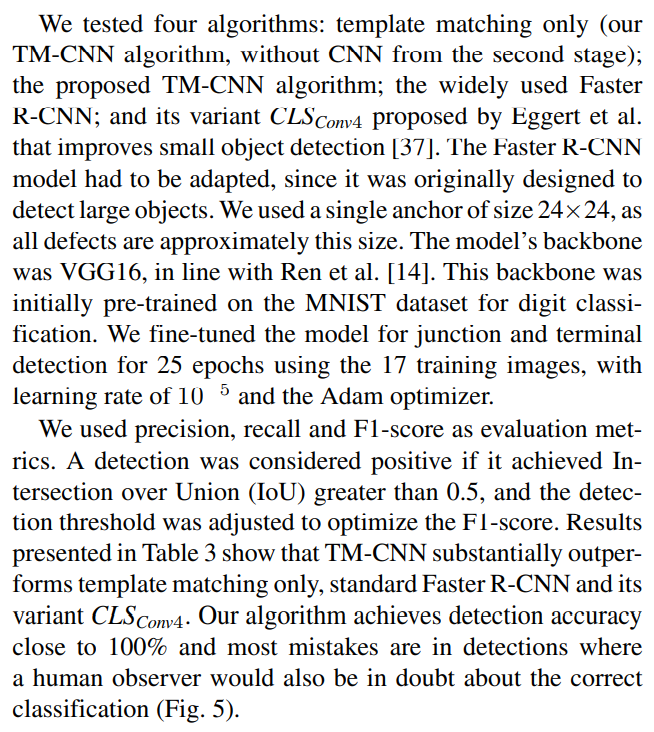
Table of Links IV. EXPERIMENTS AND RESULTS A. PERFORMANCE EVALUATIONEvaluating TM-CNN poses a certain challenge because there are no benchmarks or published results for direct comparison. So, we defined that junction and terminal detections reviewed by human observers as the gold standard and compared the algorithms against this standard. For testing purposes, we annotated 5 independent images from varying experiments, using the same procedure as the training images (subsection III-E). False detections were excluded since they do not contribute to the detection evaluation. In total, the test set contained 3,551 junctions and 3,653 terminals.
\

\

\

In Bi:YIG films, it is known that a perfect stripe pattern is the most energetically favorable and stable configuration of magnetic moments [4]. In this structure, the magnetic moments exhibit stripes aligning straight in one direction throughout the entire structure, resulting in large spatial coherence. Meanwhile, the experimentally obtained structures often manifest labyrinthine patterns, as illustrated by dark and bright stripes in Fig. 1. In these labyrinthine patterns, stripes are aligned within small domains but propagate in different directions between different domains, and thus the spatial coherence of stripes is smaller than the perfect stripe. Notably, junctions and terminals are defects emerging in the formation of these labyrinthine patterns, intricately linked to the growth of spatial coherence in the system. Introducing such defects into the perfect stripe structure leads to the bending and branching of the initially aligned stripes, eventually reducing spatial coherence accompanied by the transformation to labyrinthine patterns. Indeed, a plethora of defects are observed in the labyrinthine patterns shown in Fig. 2. Conversely, the elimination of these defects plays a crucial role in the transition from a quenched state to an annealed state, where the system increases the spatial coherence.
\ Each of these defects cannot be eliminated alone by continuous deformation of the stripes due to their topological properties. They can be removed through the pair annihilation. For instance, in Fig. 2, terminals are branched from junctions and they can be removed pairwisely by reducing the branching distance. These defects, known as topological defects, are widely recognized for playing a crucial role in the formation of periodic structures. By detecting the positions of defects, the evolution of the labyrinthine patterns would be systematically quantified. Specifically in the context of magnetic labyrinthine patterns, a much smaller dataset was used to detect these defects manually [4]. Recently, persistent homology has been used to extract the topological features of the labyrinthine patterns in a systematic way [38]. However, it is still difficult to detect the positions of defects and classify them into junctions and terminals.
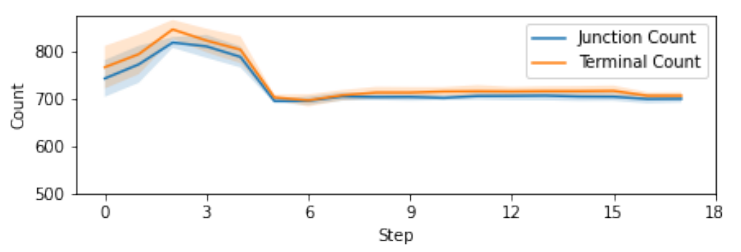
\ In this article, we achieved the systematic detection. To quantify the evolution of the labyrinthine patterns, we applied the TM-CNN technique to the 444 images and investigated how the number of defects and their locations changes step by step. Fig. 6 illustrates the step dependence of the number of junctions and terminals during the demagnetization process. Results from 6 different experimental runs were averaged to estimate the number of defects. In the initial stages of the demagnetization process, there are approximately 800 defects. The number of defects sharply decreases around step 5 and remains nearly unchanged from step 10 onward. Consequently, the transition to the quenched state is inferred to start before step 5 and be completed by step 10. The reduction in the number of defects during the demagnetization process is compatible with the naive expectation based on the physical argument of a decrease in the number of defects associated with the increased spatial coherence of the stripes. Furthermore, the number of junctions and terminals are close, which is consistent with the topological argument that junctions and terminals are paired.
\ Further quantification of the evolution of the labyrinthine patterns based on the spatial distribution of the defects (and not only on their number) is discussed in another article [6].
\

\
:::info This paper is available on arxiv under CC BY 4.0 DEED license.
:::
\
- Home
- About Us
- Write For Us / Submit Content
- Advertising And Affiliates
- Feeds And Syndication
- Contact Us
- Login
- Privacy
All Rights Reserved. Copyright , Central Coast Communications, Inc.