and the distribution of digital products.
Controlling Automated Vehicles on Large Lane-free Roundabouts: Simulation Results
:::info Authors:
(1) Mehdi Naderi;
(2) Markos Papageorgiou;
(3) Dimitrios Troullinos;
(4) Iasson Karafyllis;
(5) Ioannis Papamichail.
:::
Table of LinksThe Nonlinear Feedback Control
OD Corridors and Desired Orientations
Boundary and Safety Controllers
Appendix A: Collision Detection
Appendix B: Transformed ISO-Distance curves
Appendix D: Safety Controller Details
Appendix E: Controller Parameters
VI. SIMULATION RESULTSThe developed control strategy is generic and can be applied to any complex circular roundabout. In fact, in the design
\
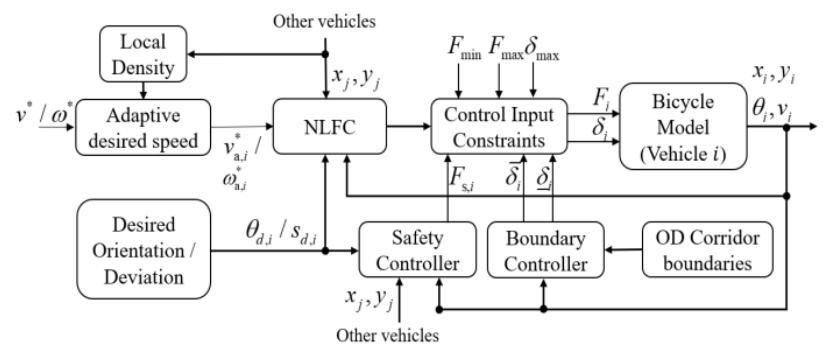
\ procedure, we do not use any specific details of the case study. The only geometrical assumption is that inner and outer boundaries are circular, which is shared by a large number of roundabouts. Also, the branches are introduced by angular positions and widths; hence, any possible topology of branches, either symmetric or asymmetric, can be considered. In this section, we consider, as a case study, the famous Place Charles de Gaulle roundabout (Paris, France), that has an outer (inner) radius of 84 m (46 m), hence featuring a width of 38 m. It comprises 12 bidirectional branches, resulting in 144 distinct OD movements. The horizontal branch on the right in Fig. 1 is the famous Champs-Élysées Avenue. This is likely the most complex real case study for a roundabout.
\ A. Simulation Set-up and Control Parameters
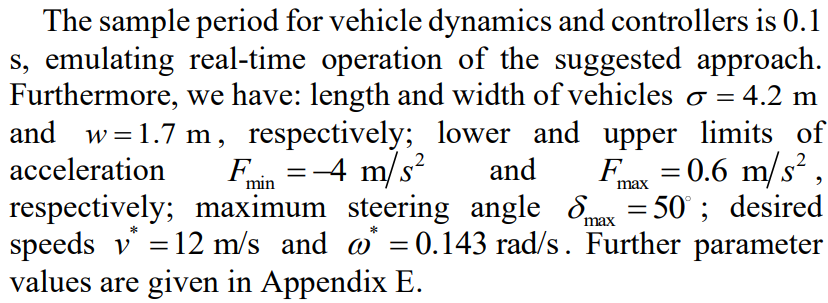
\ The proposed control system is implemented in the TrafficFluid-Sim platform [40] which is an extension of the SUMO simulator [41]. Several modifications have been made to facilitate the simulation of vehicles on a roundabout using the proposed strategy [40]. In particular, the discrete-time bicycle model (8) was added to the simulator to represent vehicle dynamics with higher accuracy than the double-integrator model, in view of stronger vehicle turnings in the urban environment. All 144 OD routes are considered, and the individual OD demand flows are defined proportional to the product of the widths of the corresponding entrance and exit branches. The simulation covers, beyond the roundabout, also the connected branches up to a distance of 65 m from the outer roundabout boundary. Thus, entering (exiting) vehicles are released (dropped) at 65 m upstream (downstream) of the roundabout.
\
\ B. Microscopic Results
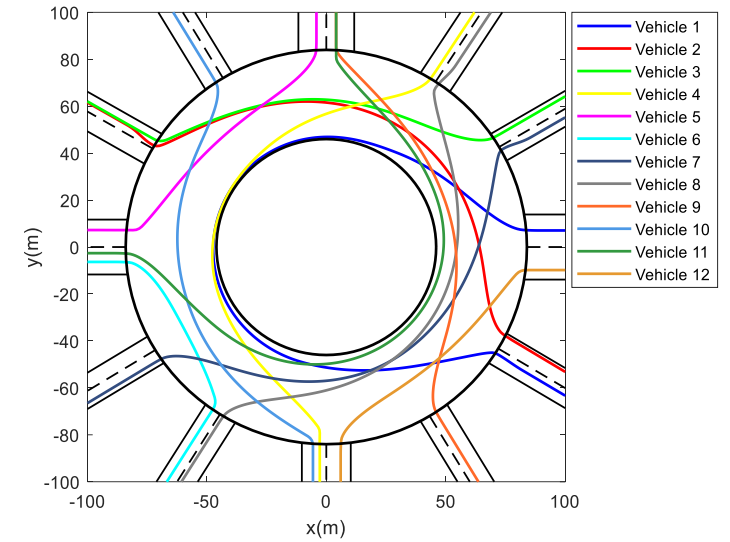
\ To assess the pertinence of the proposed methodology, a simulation of 12 vehicles with various ODs on Place Charles de Gaulle roundabout is initially conducted. The simulation results are depicted in Figs. 9 - 12. As can be seen in Fig. 9, vehicle paths on the roundabout are smooth, and all vehicles are appropriately guided to their respective destinations. The vehicles with distant destinations, e.g. vehicles 1, 4, and 11, drive partially close to the inner boundary. Other vehicles,
\
\
\
\
\ particularly those with closer destinations, like vehicles 5, 6, and 12, do not approach the inner roundabout parts.
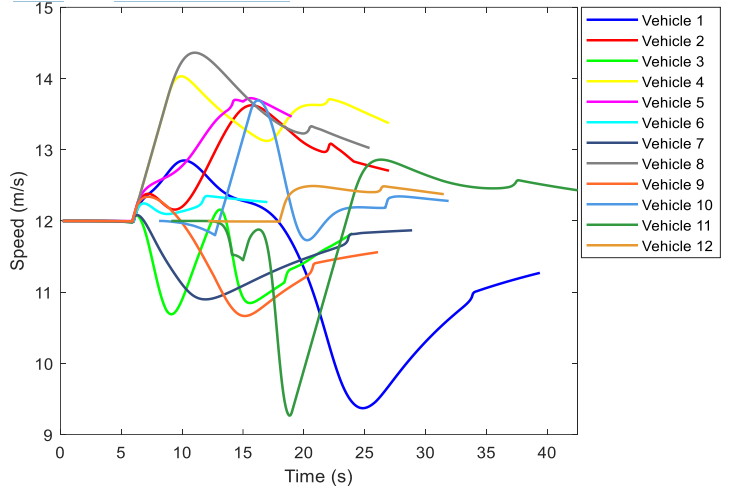
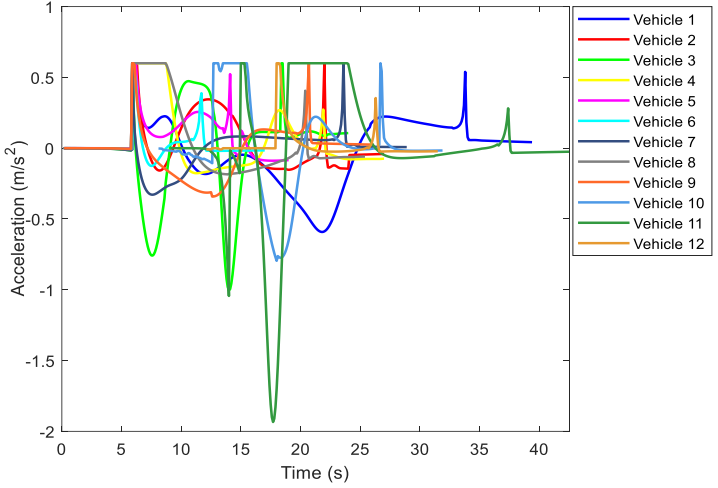
\ Vehicles tend to follow the desired speed, i.e. 12 m/s, both on the branches and on the roundabout. However, they may temporarily deviate (positively or negatively) from the desired speed to avoid collisions, see Fig. 10. For instance, vehicle 8 is nudged by other vehicles and reaches up to 14.5 m/s, which is still less than the maximum allowed speed. In addition, Fig. 11 illustrates vehicle accelerations in which their efforts to, on one hand, track the desired speed and, on the other hand, avoid colliding with other vehicles via occasional decelerations can be observed. Note that, when the roundabout is not crowded, like in this simulation, vehicles drive fast, and some of them, e.g. vehicles 3 and 11, may need to generate strong deceleration when encountering another vehicle approaching from a different angle. In contrast, in high-density situations, vehicles drive at lower speed, and consequently any produced collision avoidance decelerations are smaller.
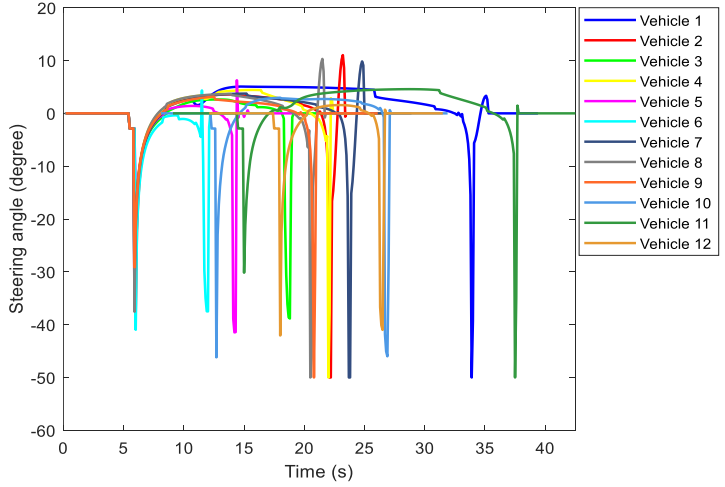
\ Finally, vehicle steering angles are displayed in Fig. 12 where sharp values reasonably occur when a vehicle enters or exits from the roundabout. In fact, it is necessary to have a significant turning, similar to human driving, when entering the roundabout, to avoid perpendicular motion. Also, while exiting, vehicles need to turn relatively sharply to adapt to the exiting branch orientation. Besides, some smooth steering angles are generated while rotating on the roundabout to avoid collisions.
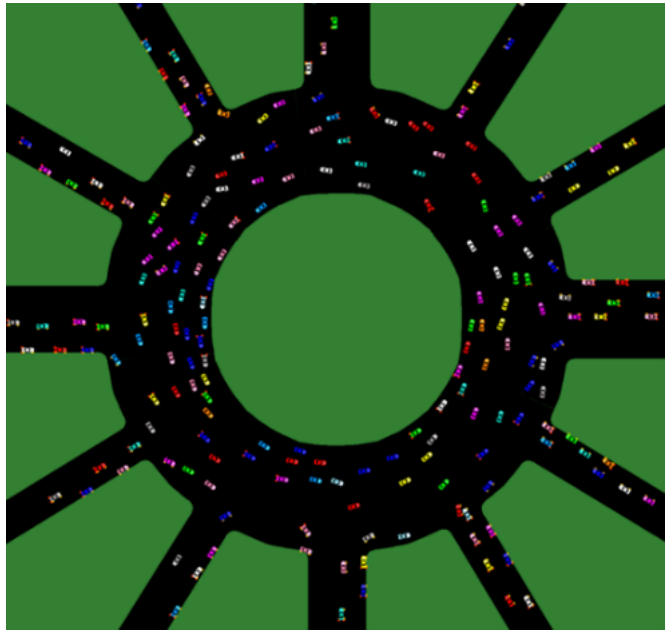
\ A second simulation involving a total of 1600 vehicles over a period of 26 min is carried out to confirm the effectiveness of the presented approach in crowded situations. A snapshot of the simulation is depicted in Fig. 13, and a video is available at https://bit.ly/36exR42. As shown in the video, vehicles move towards their destinations without exceeding the roundabout boundaries, though occasionally driving on them by the intervention of the boundary controller, and without any collision. When the roundabout is not crowded (at the start and end of the simulation), vehicles drive fast, close to their desired speed; slowing down occasionally to give way to other vehicles, as in the 12-veh simulation above. In crowded situations, vehicles may have frequent limited accelerations and decelerations to advance in the traffic and avoid collisions, as
\
\ also experienced in a human-driven vehicle in similar conditions.
\ C. Macroscopic Results
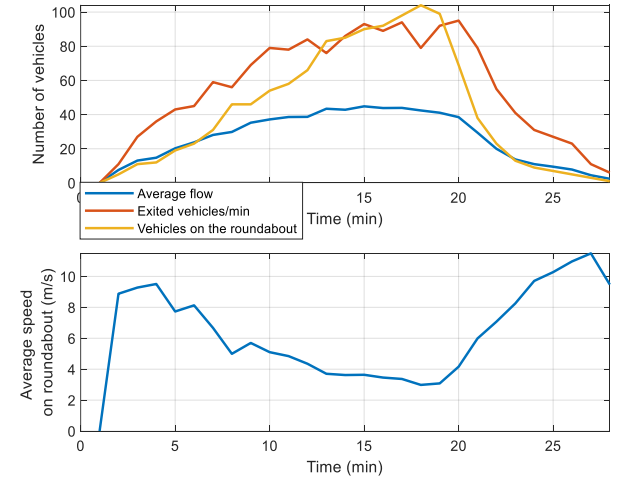
\ As mentioned earlier, roundabouts are critical elements within urban road networks, hence it is important that the employed vehicle movement strategy yields an appropriate throughput. To investigate such traffic flow aspects, the extraction of macroscopic traffic data of the roundabout operation is useful. Specifically, considering a sampling period of 1 min, we measure a few variables, including the number of vehicles on the roundabout, the number of exited vehicles, the average speed of vehicles on the roundabout, and the roundabout average flow; the last one is the average of 12 detector measurements installed between each two consecutive branches.
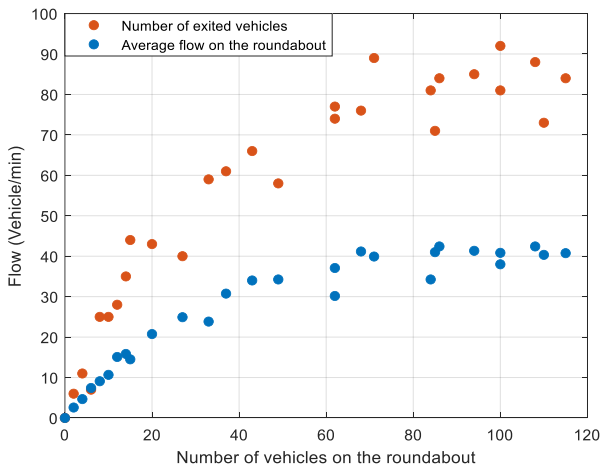
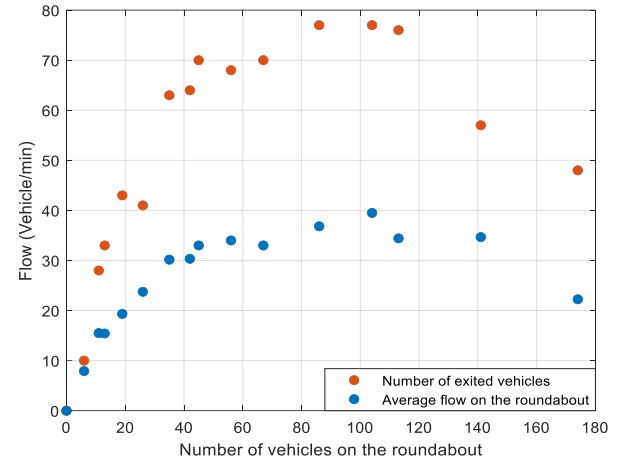
\ The roundabout’s fundamental diagram (FD) is obtained by plotting the number of exited vehicles or the average flow on the roundabout versus the number of vehicles on the roundabout (density) for all sampling periods, as illustrated in Fig. 14 for the case corresponding to the presented video. It may be seen that, as the demand arriving from the branches (and hence the roundabout density) increases, the throughput on the roundabout increases, until it saturates for high density values. No throughput deterioration is observed at high densities. This macroscopic behavior appears because of giving priority to the rotating vehicles, since the entering vehicles reduce their speed and merge into the roundabout more conservatively if they encounter high density (see Section III.C). As a result, although the average speed reduces at higher densities, no gridlock, the
\
\
\ situation in which the average speed drops to almost zero, appears on the roundabout, while some small queues can be observed on the entrance branches.
\ The time-histograms of the mentioned macroscopic variables are shown in Fig. 15 where the minimum average speed occurs when the number of vehicles on the roundabout is maximum. Note that the decrease in the flow and the number of exited vehicles, after the 19th sample, is due to the smaller entrance flows.
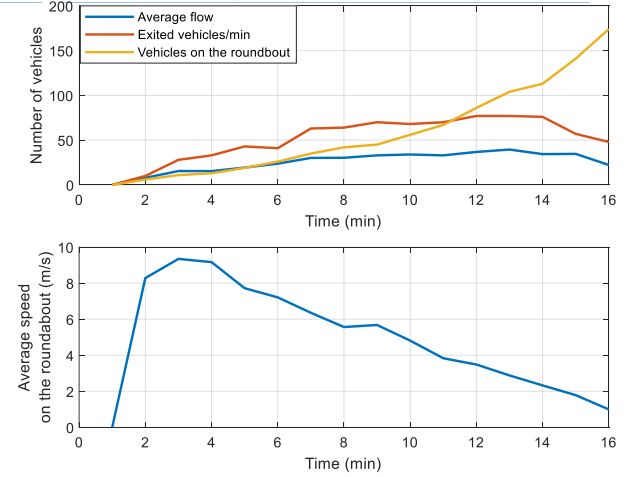
\ It is interesting to investigate what happens if the entering vehicles, rather than the rotating ones, are prioritized. This can be implemented by making some minor changes in the control system. Firstly, the dependence of the desired speed of the entering vehicles on the density of the roundabout sector, i.e. (20), is canceled. Secondly, we increase the potential function of entering vehicles, as seen by rotating vehicles, to increase their importance (repulsion) in collision avoidance. As a result, in conflicts between an entering vehicle and a rotating one, the latter yields to let the former enter the roundabout. Fig. 16 depicts the resulting FD where now the decreasing flow part becomes visible at high densities. In fact, the vehicles continue entering the roundabout even if there are many vehicles in front of them, which results in quasi-gridlock, while there is no queue on the entrance branches. In this situation, the average speed decreases to values close to zero, while the number of exited vehicles and average flow drop significantly, see Fig. 17. Notice that the change affects the FD mainly for high densities, while the capacity and critical density differences are minor. Interestingly, in the real system, entering vehicles have priority over rotating vehicles on the roundabout. Unfortunately, it was
\
\
\ not possible to receive real data reflecting the current operation of the roundabout.
\
:::info This paper is available on arxiv under CC 4.0 license.
:::
\
- Home
- About Us
- Write For Us / Submit Content
- Advertising And Affiliates
- Feeds And Syndication
- Contact Us
- Login
- Privacy
All Rights Reserved. Copyright , Central Coast Communications, Inc.