and the distribution of digital products.
Comprehensive Overview of GNN Experiments: Hardware, Hyperparameters, and Findings
:::info Authors:
(1) Junwei Su, Department of Computer Science, the University of Hong Kong and [email protected];
(2) Chuan Wu, Department of Computer Science, the University of Hong Kong and [email protected].
:::
Table of Links5 A Case Study on Shortest-Path Distance
6 Conclusion and Discussion, and References
9 Procedure for Solving Eq. (6)
10 Additional Experiments Details and Results
11 Other Potential Applications
10 Additional Experiments Details and ResultsIn this appendix, we provide additional experimental results and include a detailed set-up of the experiments for reproducibility.
\

All the experiments of this paper are conducted on the following machine CPU: two Intel Xeon Gold 6230 2.1G, 20C/40T, 10.4GT/s, 27.5M Cache, Turbo, HT (125W) DDR4-2933 GPU: four NVIDIA Tesla V100 SXM2 32G GPU Accelerator for NV Link Memory: 256GB (8 x 32GB) RDIMM, 3200MT/s, Dual Rank OS: Ubuntu 18.04LTS
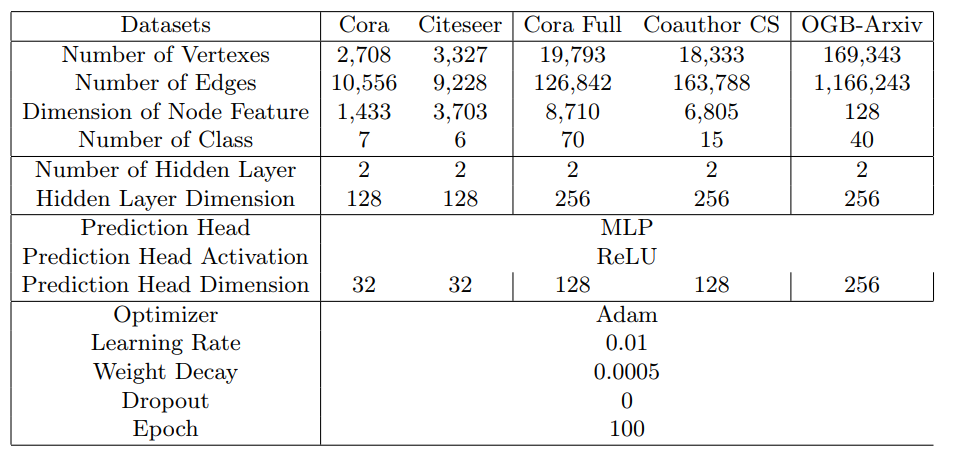
10.2 Training Hyper-parameters and Detailed Dataset DescriptionTable 3 gives a more detailed description of the statistic of datasets used in the experiment as well as the hyper-parameters used for training. We keep the hyper-parameters the same across different models. To keep the experiment consistent, we do not employ randomized regularization techniques such as dropout. To ensure a fair comparison, we make sure each experiment is trained till convergence.
10.3 Additional Experiment ResultsIn addition to the datasets we present in the main text, we also conduct experiments on Citeseer, Cora Full and OGBN-arxiv. The results of these experiments show that the theoretical structures proved in this paper are indeed consistent across different datasets. Next, we present additional experimental results on these datasets for validating the main theorems of our papers.
\ Graph Distance and Performance We present additional results with Citeseer, CoraFull, and OGBN-Arxiv on the relation between the graph distance (shortest-path distance). For these experiments, we follow the same setting as the one presented in Fig. 4. We compute the average prediction accuracy in each group of vertices (corresponding to vertices at each hop of the neighbourhood of the training set). ’0 hop’ indicates the training set. We observe that GNNs tend to predict better on the vertices that are closer to the training set. The results are presented in Fig. 6, 7 and 8.
\

\ Subgroup Embedding Distance and Accuracy We present additional results with Citeseer, CoraFull, and OGBN-Arxiv on that GNNs preserve distances (with a small distortion rate) locally, by evaluating the relation between the graph distances of vertices to the training set and the embedding distances (Euclidean distance) of vertex representations to the representations of the training set, i.e., the relation between d(v, D) and d(MθD (v),MθD (D)). In this experiment, we follow the same setting as the one in Fig. 3 and train the GNN models on the default training set provided in the dataset. We extract vertices within the 5-hop neighbourhood of the training set and group the vertices based on their distances to the training set. We then compute the average embedding distance of each group to the training set in the embedding space. Based on Def. 3, if an embedding has low distortion, we should expect to see linear relation with slop being the scaling factor. As shown in Fig. 9,Fig. 10, and Fig. 11 there exists a strong correlation between the graph distance and the embedding distance. The relation is near linear and the relative orders of distances are mostly preserved within the first few hops. This implies that the distortion α is indeed small with different GNNs and that the common aggregation mechanism of GNNs can well capture local graph structure information (i.e., graph distances). It also indicates that the premise on the distortion rate, which we used to prove our theoretical results, can be commonly satisfied in practice.
10.4 Graph Distance and Performance
\

\

\

\

\

\
:::info This paper is available on arxiv under CC BY 4.0 DEED license.
:::
\
- Home
- About Us
- Write For Us / Submit Content
- Advertising And Affiliates
- Feeds And Syndication
- Contact Us
- Login
- Privacy
All Rights Reserved. Copyright , Central Coast Communications, Inc.