and the distribution of digital products.
Buy the Dip in Celestia? TIA Crypto Price Analysis
Tia crypto is in a good buying zone, with the correction phase underway. It is a good zone for accumulation.
Resistance Breakout. Once a price breaks above a resistance zone, it signals that buyers have absorbed all the supply from sellers at this level and price can resume it’s advance. Following a resistance breakout, the next closest resistance zone becomes a price target.
For on-demand analysis of any cryptocurrency, join our Telegram channel.
TIA Price Analysis- Latest Price: $5.74 – $5.76 USD
- Market Cap: $1.2 billion
- 24h Trading Volume: $184 million
- Circulating Supply: 210 million TIA
- Total Supply: 1 billion TIA
- Current Trend: -5.30% in the last 24 hours, -8.90% in the past week.
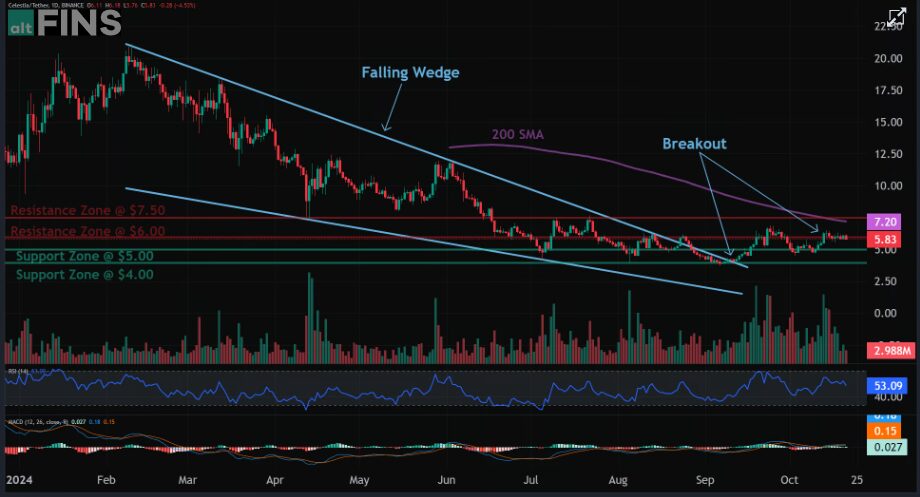
 Img src- Altfins
Trends are mixed but improving after it had a bullish breakout from Falling Wedge pattern. Price has now also broken above $6.00 resistance and could revisit $7.50 for a +25% gain. Stop Loss at $4.70.
Buy Now Weekly Price AnalysisIn October, TIA has seen a downward trend, with prices fluctuating between $6.51 and $5.74. This dip aligns with market-wide trends in response to an expected token unlock at the end of the month, which will release $1.1 billion worth of TIA tokens into circulation.
Trend: Short-term trend is Up, Medium-term trend is Up, Long-term trend is Down.
Momentum is Bullish ( MACD Line crossed above MACD Signal Line) ABOVE days ago. Price is neither overbought nor oversold currently.
Support and Resistance: Nearest Support Zone is $5.00, then $4.00. Nearest Resistance Zone is $6.00, then $7.50.
Indicators and Technical Analysis Moving Averages- 50-Day Moving Average: $6.20 (Bearish crossover in early October)
- 200-Day Moving Average: $7.10 (Significant resistance level)
- Current RSI: 42, indicating TIA is approaching oversold territory, but not quite there yet.
- The MACD indicator is showing a bearish signal, suggesting the possibility of further downward momentum.
- Support Level: $5.50
- Resistance Level: $6.80
One of the biggest upcoming events for TIA is the token unlock scheduled for October 31st, 2024. This unlock will release 175.75 million tokens. The unlocked tokens will be distributed to early contributors, research and development efforts, and Series A/B investors.
Fundraising and Ecosystem GrowthCelestia raised over $100 million in funding in 2022. Celestia’s modular approach separates consensus from execution, enabling developers to launch custom blockchains efficiently.
For on-demand analysis of any cryptocurrency, join our Telegram channel.
- Home
- About Us
- Write For Us / Submit Content
- Advertising And Affiliates
- Feeds And Syndication
- Contact Us
- Login
- Privacy
All Rights Reserved. Copyright , Central Coast Communications, Inc.