and the distribution of digital products.
BONK Crypto Swing Trade: Bullish pattern emerging?
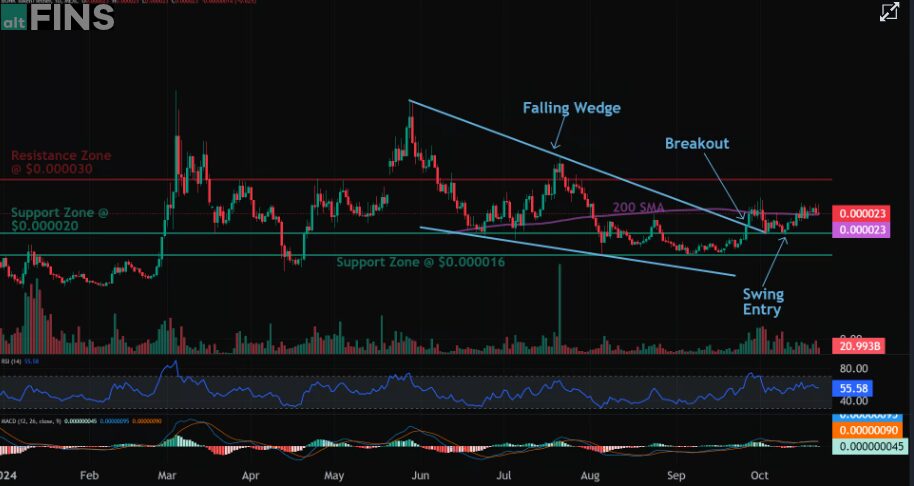
Falling Wedge usually results in a bullish breakout. When price breaks the upper trend line the price is expected to trend higher.
Emerging patterns (before a breakout occurs) can be traded by swing traders between the convergence lines; however, most traders should wait for a completed pattern with a breakout and then place a BUY order.
For on-demand analysis of any cryptocurrency, join our Telegram channel.
Bonk Crypto Price PredictionBonk (BONK) is trading at $0.0000232.
- Market Cap: $1.61 billion
- 24h Trading Volume: $374.7 million
- Circulating Supply: 69.47 trillion BONK
- Total Supply: 93.53 trillion BONK
 Img src- Altfins
Breakout from Falling Wedge pattern has signaled a bullish trend reversal. We would be buyers on breakout retest around $0.000020 key level, with +20% upside potential to $0.000024 thereafter. Stop Loss at $0.000018.
Buy Now Weekly Price AnalysisOver the past week, BONK’s price has shown some stability despite market fluctuations, with a 2.26% increase. The price has fluctuated within a narrow range, testing lows of $0.000023 and highs around $0.0000247.
- 24h Price Change: -1.55%
- 7d Price Change: +2.26%
- All-Time High: $0.0000455 (March 4, 2024)
- All-Time Low: $0.000000086 (December 29, 2022)
- Trend: Short-term trend is Strong Up, Medium-term trend is Strong Up, Long-term trend is Down.
- Momentum is Bullish but inflecting. MACD Line is still above MACD Signal Line but momentum may have peaked since MACD Histogram bars are declining, which suggests that momentum could be nearing a downswing. Price is neither overbought nor oversold currently.
- Support and Resistance: Nearest Support Zone is $0.00002, then $0.000016. Nearest Resistance Zone is $0.00003.
- Relative Strength Index (RSI): Currently at 46.30.
- Bollinger Bands: Expanding, showing increased volatility with resistance at $0.00002435 and support near $0.00002278.
- Moving Averages (MA): Key MAs such as the 50-day and 200-day remain in buy zones.
BONK has attracted attention for its potential Exchange Traded Product (ETP) listing. The listing aims to bring institutional interest to the meme coin, possibly increasing liquidity and price stability.
If BONK manages to break its resistance at $0.0000255, it could climb towards $0.000033 in the medium term
For on-demand analysis of any cryptocurrency, join our Telegram channel.
- Home
- About Us
- Write For Us / Submit Content
- Advertising And Affiliates
- Feeds And Syndication
- Contact Us
- Login
- Privacy
All Rights Reserved. Copyright , Central Coast Communications, Inc.