and the distribution of digital products.
DM Television
ZeroShape: The Metrics and Evaluation Protocol That We Used
3. Method and 3.1. Architecture
3.2. Loss and 3.3. Implementation Details
4. Data Curation
5. Experiments and 5.1. Metrics
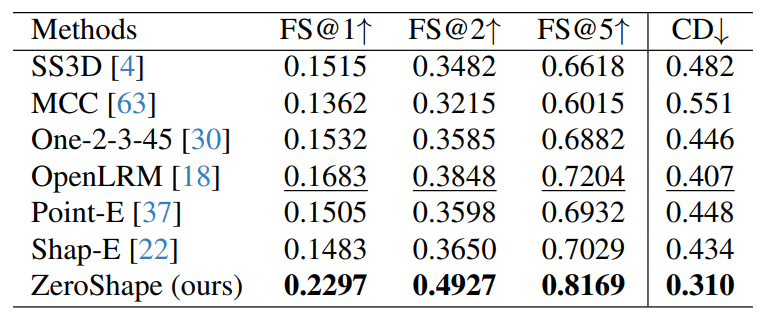
5.3. Comparison to SOTA Methods
5.4. Qualitative Results and 5.5. Ablation Study
\ A. Additional Qualitative Comparison
B. Inference on AI-generated Images
5. ExperimentsIn this section we present our experiments, which include state-of-the-art comparisons and ablations. We first describe the baselines we implemented on our benchmark, and then show detailed quantitative and qualitative results.
5.1. MetricsWe evaluate the shape reconstruction models using Chamfer Distance (CD) and F-score as our quantitative metrics following [15, 19, 20, 28, 55, 56].
\ Chamfer Distance. Chamfer Distance (CD) measures the alignment between two pointclouds. Following [20], CD is defined as an average of accuracy and completeness. Denoting pointclouds as X and Y , CD is defined as:
\

\ F-score. F-score measures the pointcloud alignment under a classification framing. By selecting a rejection threshold d, F-score@d (FS@d) is the harmonic mean of precision@d and recall@d. Specifically, precision@d is the percentage of predicted points that lies close to GT point cloud within distance d. Similarly, recall@d is the percentage of ground truth points that have neighboring predicted points within distance d. FS@d can be intuitively interpreted as the percentage of surface that is correctly reconstructed under a certain threshold d that defines correctness.
\ Evaluation protocol. To compute CD and F-score, we grid-sample the implicit function and extract the isosurface via Marching Cubes [32] for methods using implicit representation. Then we sample 10K points from the surfaces for the evaluation of CD and F-scores. Because most methods cannot predict view-centric shapes, we use bruteforce search to align the coordinate frame of prediction with

\ ground truth before calculating the metrics. This evaluation protocol ensures a fair comparison between methods with different shape representation and coordinate conventions.
\
:::info This paper is available on arxiv under CC BY 4.0 DEED license.
:::
:::info Authors:
(1) Zixuan Huang, University of Illinois at Urbana-Champaign and both authors contributed equally to this work;
(2) Stefan Stojanov, Georgia Institute of Technology and both authors contributed equally to this work;
(3) Anh Thai, Georgia Institute of Technology;
(4) Varun Jampani, Stability AI;
(5) James M. Rehg, University of Illinois at Urbana-Champaign.
:::
\
- Home
- About Us
- Write For Us / Submit Content
- Advertising And Affiliates
- Feeds And Syndication
- Contact Us
- Login
- Privacy
All Rights Reserved. Copyright , Central Coast Communications, Inc.