and the distribution of digital products.
Social media benchmarks for financial services: Q3 2024 data
If you’re using social media for marketing and communications at a bank, credit union, or other financial institution, you might find reporting on your progress tricky. How do you know if your strategy is working? Is an average of 100 comments per week good, or is it just average? And when is the best time to publish your content?
There is no universal answer — it all depends on factors like your sector, the platforms you’re using, your audience demographics, and more.
That’s where social media benchmarks come in. These numbers offer a clear view of what’s normal for your industry in terms of engagement and growth, helping you understand how your results compare.
Read on for the most recent social media benchmarks and stats specific to the FinServ industry that will put your performance into perspective.
Psst: Once you grab your benchmarks, head to our guide to using social media in financial services to find out how to action these insights.
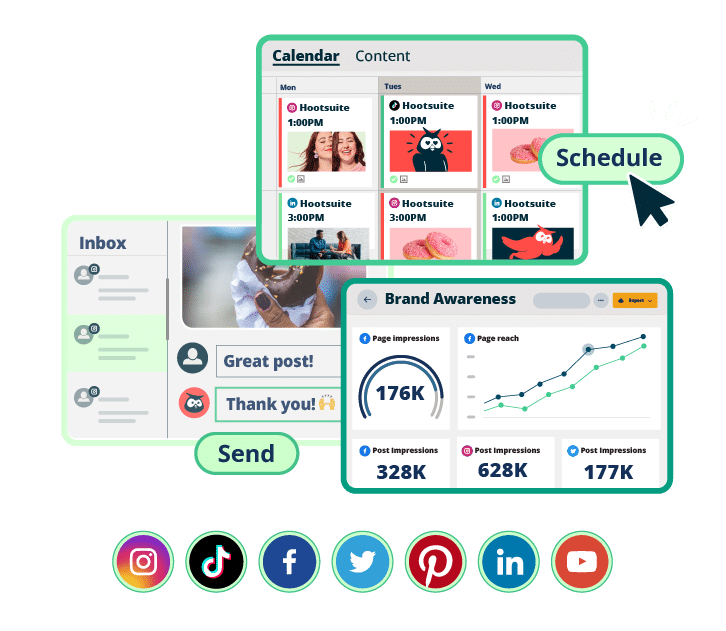 #1 Social Media Tool for Financial Services
Grow your client base with the tool that makes it easy to sell, engage, measure, and win — all while staying compliant.
Book a Demo Best times to post on social media for financial servicesBelow, you’ll find recommendations for the best times to post on Facebook, Instagram, LinkedIn, and X (formerly Twitter) for maximum engagement.
Note: Time of day was localized across 118 countries where sample data came from, i.e. the graphs are accurate across time zones.
Best time to post on FacebookAccording to our research, early morning (5-7 am) on Monday is the best time for financial institutions to post on Facebook — but, in general, engagement stays consistent throughout the week.
 Best time to post on Instagram
Mornings are the best time to post on Instagram in FinServ. Posts published between 7 and 11 am on Tuesdays and Wednesdays, and 10 am and noon on Fridays seem to generate the highest engagement.
 Best time to post on LinkedIn
On LinkedIn, posts published between 6 and 8 pm on Thursday get the most interactions.
 Best time to post on X (Twitter)
Thursday night (10 pm) and Friday evening (8 pm) Tweets tend to generate the highest engagement for financial institutions on X.
 How often should you post on social media in financial services?
Every financial institution’s ideal posting schedule is unique, and you should test different posting frequencies to find out what works best for your audience. That said, these industry-specific stats will help you find a data-informed starting point.
Our research found that financial institutions post on Facebook more often than on other social platforms — an average of over 7 times a week. Instagram and LinkedIn follow, with an average frequency of 6 posts per week on both platforms.

Below, you’ll find network-specific data that illustrates how posting frequency corresponds to overall engagement rates.

On Facebook, performance depends on the quality of the content you post more than it does on how often you post. FinServ institutions that posted twelve times a week have seen similar engagement rates to those posting an average of only once per week.

On Instagram, 10 updates (posts, Stories, and/or Reels) per week is the sweet spot in FinServ.

On X, you don’t need a busy posting schedule to keep your audience engaged. 1-2 posts a week are the sweet spot for financial institutions.

The same goes for LinkedIn. Financial institutions posting only once a week see the highest average engagement on their content — but, interestingly, engagement is similarly high for profiles that post 10 times a week.
Average engagement rates in financial servicesWondering if your engagement rates are high enough? Here are the industry averages across all major social networks as of September 2024:
- Instagram: 5%
- Facebook: 3.6%
- X (Twitter): 3%
- LinkedIn: 2.5%
- TikTok: 1.6%
 What should financial institutions post on social media?
Different social networks offer different content formats — but how do you decide which should dominate your content mix?
Here’s what our research says.

On Facebook, album posts generate the most engagement — followed by posts with individual photos, videos, and links.
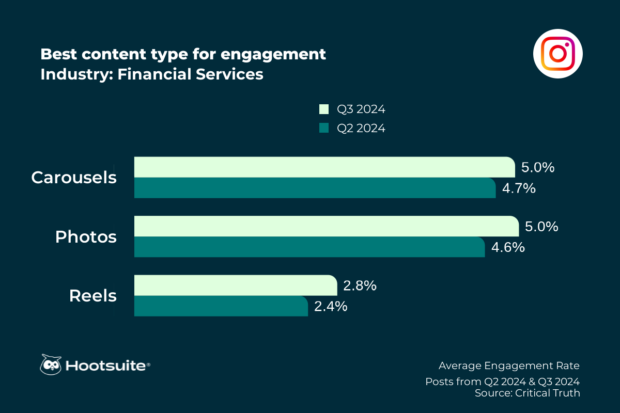
Instagram users are most likely to interact with carousels, followed by regular photo posts and Reels.

On LinkedIn, posts with photos and videos outperform posts with links and text-only status updates.
Follower growth rate in financial servicesIf your social media strategy revolves around growing your audience, make sure you’re setting realistic goals. Here is how other FinServ profiles are doing in Q3 2024:
- LinkedIn: 0.56%
- Instagram: 0.47%
- X (Twitter): 0.47%
- Facebook: 0.02%

Hootsuite makes social marketing easy for financial services professionals. From a single dashboard, you can manage all your networks, drive revenue, provide customer service, mitigate risk, and stay compliant.
Book a demoGet more leads, engage customers and stay compliant with Hootsuite, the #1 social media tool for financial services.
Book a DemoThe post Social media benchmarks for financial services: Q3 2024 data appeared first on Social Media Marketing & Management Dashboard.