and the distribution of digital products.
Sensitivity Analysis of Block Lookback Periods on Ethereum Gas Prices
2 Background and 2.1 Blockchain
4 Computing Transaction Processing Times
5 Data Collection and 5.1 Data Sources
6 Results
6.1 RQ1: How long does it take to process a transaction in Ethereum?
7 Can a simpler model be derived? A post-hoc study
11 Conclusion, Disclaimer, and References
\ A. COMPUTING TRANSACTION PROCESSING TIMES
B. RQ1: GAS PRICE DISTRIBUTION FOR EACH GAS PRICE CATEGORY
B.1 Sensitivity Analysis on Block Lookback
C. RQ2: SUMMARY OF ACCURACY STATISTICS FOR THE PREDICTION MODELS
D. POST-HOC STUDY: SUMMARY OF ACCURACY STATISTICS FOR THE PREDICTION MODELS
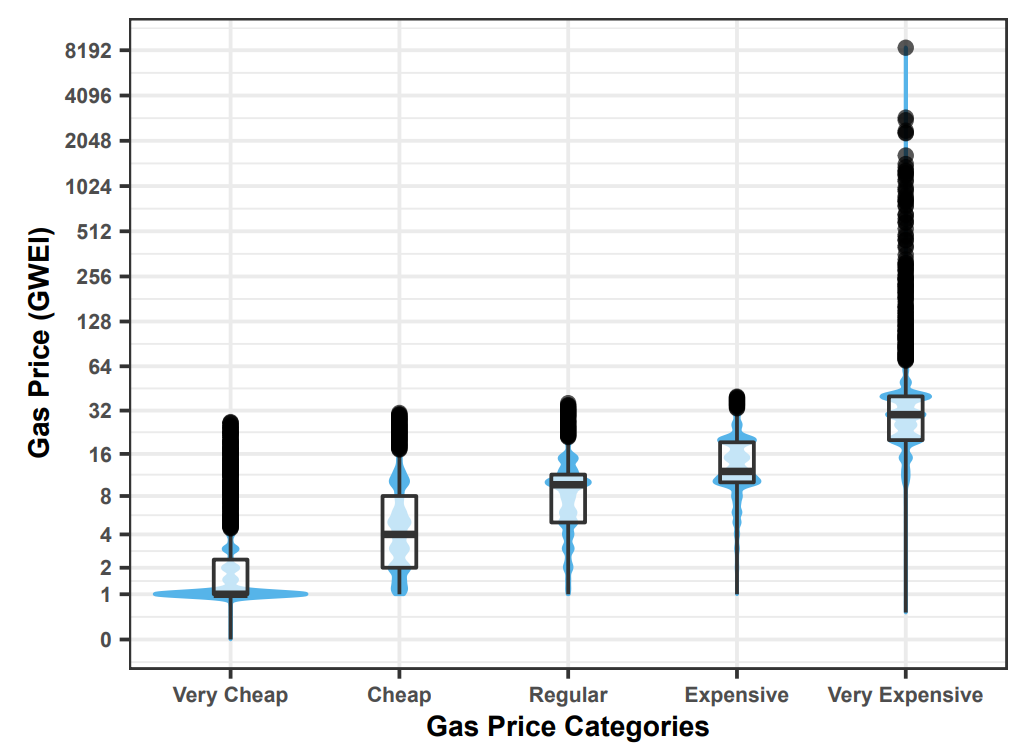
B RQ1: GAS PRICE DISTRIBUTION FOR EACH GAS PRICE CATEGORYThe gas price distribution for each gas price category is shown in Figure 21.
\
\
\ \
B.1 Sensitivity Analysis on Block LookbackIn Ethereum, a new block is appended every 15 seconds on average and each block can contain a limited number of transactions. Therefore, the gas price of transactions is strongly influenced by a demand-supply relationship. In other words, to know whether a given price x is high or low at a particular moment in time, we need to look back in time and observe how much transaction issuers are paying for their transactions.
\ There is no consensus on how further back one should go to determine what the current payment norm is. EthGasStation, the most popular gas tracker, provides gas price statistics based on the past 200 blocks[29]. Looking back 200 blocks is equivalent to looking back 200 * 15 seconds = 3,000 seconds = 50 minutes. In this study, we look back 120 blocks. Our rationale was to cover 30 minutes (half an hour). We believe that, in practice, looking back half an hour is more intuitive and straightforward than looking back 50 minutes. We performed a sensitivity analysis in order to understand how the block lookback choice influences the definition (distribution) of our five gas price categories. We evaluate the following block lookback choices: 60, 120, 180, 200 (EthGasStation) and 240. The results are shown in Figure 22.
\
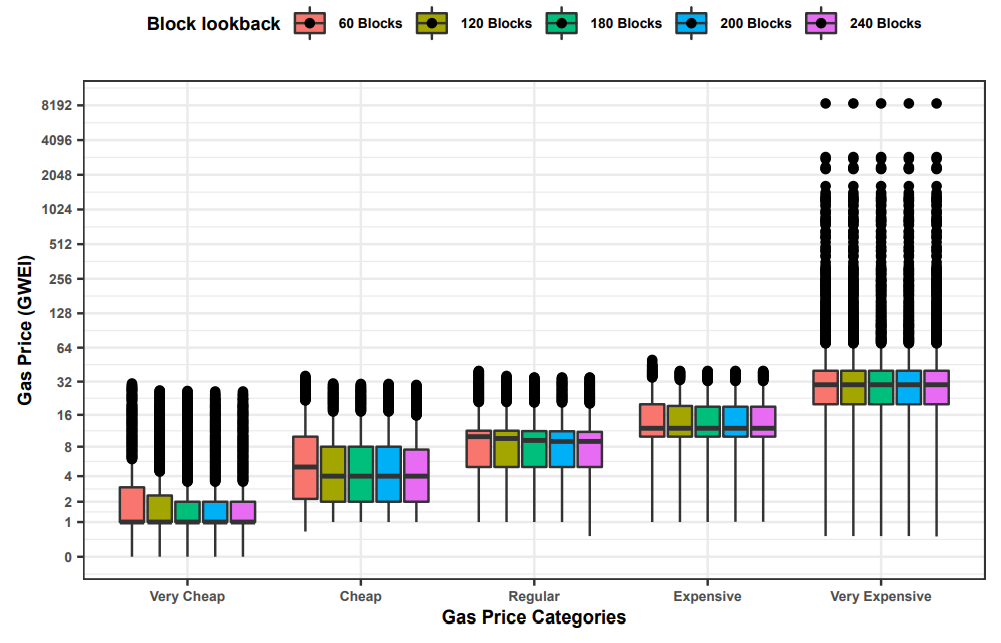
\ As depicted in Figure 22, the definition of the gas price categories is only subtly affected by the block lookback choice. Therefore, we believe that our conclusions are likely to hold to all the five lookback choices investigated in this sensitivity analysis. Further studies in the topic should more extensively evaluate the impact of the choice of the block lookback on the definition of gas prices and on the prediction of transaction processing times.
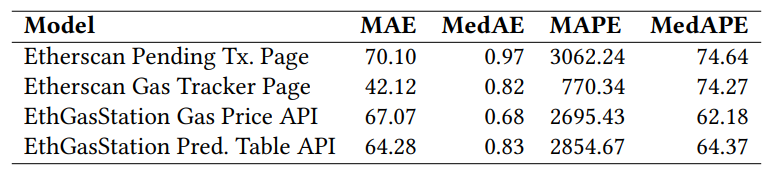
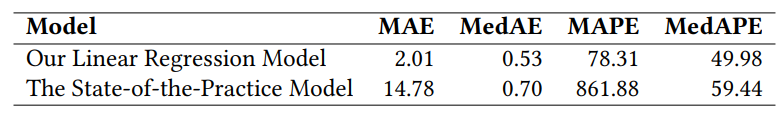
C RQ2: SUMMARY OF ACCURACY STATISTICS FOR THE PREDICTION MODELS\
\
\
\
\
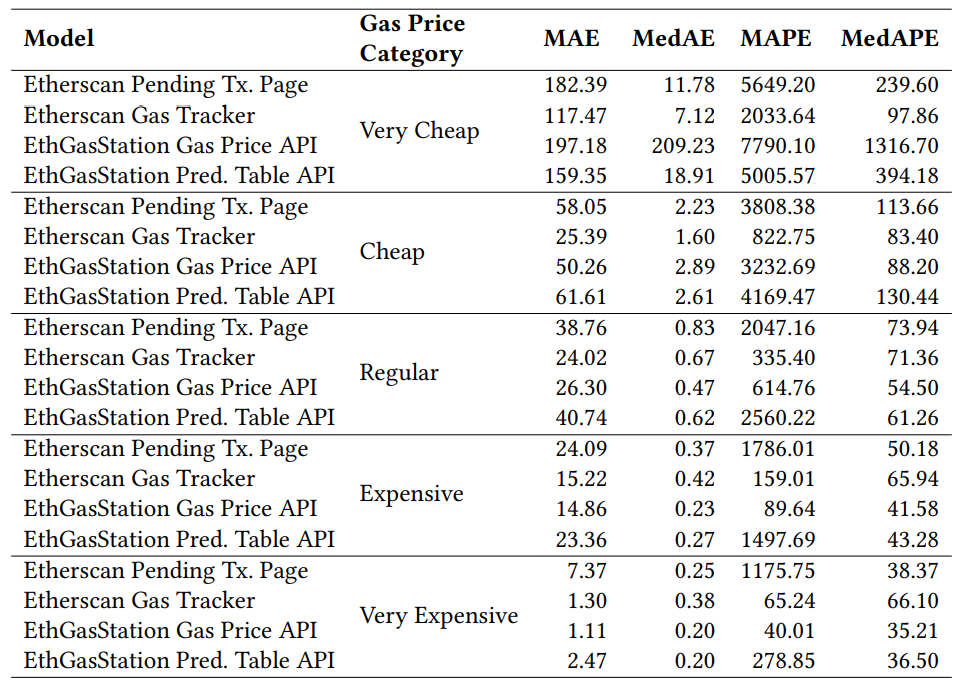
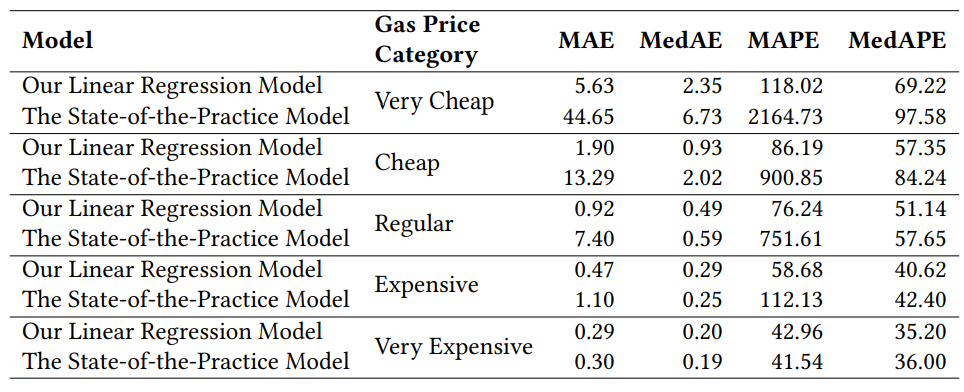
D POST-HOC STUDY: SUMMARY OF ACCURACY STATISTICS FOR THE PREDICTION MODELS\
\
\
\
\ \ \
:::info Authors:
(1) MICHAEL PACHECO, Software Analysis and Intelligence Lab (SAIL) at Queen’s University, Canada;
(2) GUSTAVO A. OLIVA, Software Analysis and Intelligence Lab (SAIL) at Queen’s University, Canada;
(3) GOPI KRISHNAN RAJBAHADUR, Centre for Software Excellence at Huawei, Canada;
(4) AHMED E. HASSAN, Software Analysis and Intelligence Lab (SAIL) at Queen’s University, Canada.
:::
:::info This paper is available on arxiv under CC BY-NC-ND 4.0 DEED license.
:::
[29] https://ethgasstation.info/txPoolReport.php