and the distribution of digital products.
Researchers Have Found a Shortcut to More Reliable AI Models
:::info Authors:
(1) Anonymous authors Paper under double-blind review Jarrod Haas, SARlab, Department of Engineering Science Simon Fraser University; Digitalist Group Canada and [email protected];
(2) William Yolland, MetaOptima and [email protected];
(3) Bernhard Rabus, SARlab, Department of Engineering Science, Simon Fraser University and bernhardt[email protected].
:::
\
- Abstract and 1 Introduction
- 2 Background
- 2.1 Problem Definition
- 2.2 Related Work
- 2.3 Deep Deterministic Uncertainty
- 2.4 L2 Normalization of Feature Space and Neural Collapse
- 3 Methodology
- 3.1 Models and Loss Functions
- 3.2 Measuring Neural Collapse
- 4 Experiments
- 4.1 Faster and More Robust OoD Results
- 4.2 Linking Neural Collapse with OoD Detection
- 5 Conclusion and Future Work, and References
- A Appendix
- A.1 Training Details
- A.2 Effect of L2 Normalization on Softmax Scores for OoD Detection
- A.3 Fitting GMMs on Logit Space
- A.4 Overtraining with L2 Normalization
- A.5 Neural Collapse Measurements for NC Loss Intervention
- A.6 Additional Figures
For all experiments we used either ResNet18 or ResNet50 models provided with the DDU benchmark code (Mukhoti et al., 2021). All were trained from fifteen independent seeds (training details can be found in Appendix A.1). All baselines used a standard cross entropy (CE) objective function during training. The NC intervention group described in Section 4.2 did not use a use a CE loss, but instead used a loss function containing the differentiable metrics described below in Section 3.2:
\

\
\ Note that the metric for NC4 is not used, as it requires an argmin function which is not differentiable. Although these metrics do not all have the same scale, they all proceed to zero, and we did not find it necessary to use any weighting scheme within the loss function.
3.2 Measuring Neural CollapseNC has four properties:
\ NC1: Variability collapse: the within-class covariance of each class in feature space approaches zero.
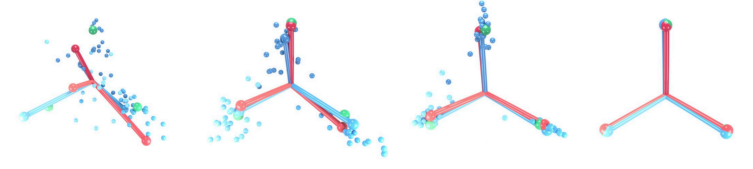
\ NC2: Convergence to a Simplex Equiangular Tight Frame (Simplex ETF): the angles between each pair of class means are maximized and equal and the distances of each class mean from the global mean of classes are equal, i.e. class means are placed at maximally equiangular locations on a hypersphere
\ NC3: Convergence to self-duality: model decision regions and class means converge to a symmetry where each class mean occupies the center of it’s decision region, and all decision regions are equally sized.
\ NC4: Simplification to Nearest Class Center (NCC): the classifier assigns the highest probability for a given point in feature space to the nearest class mean.
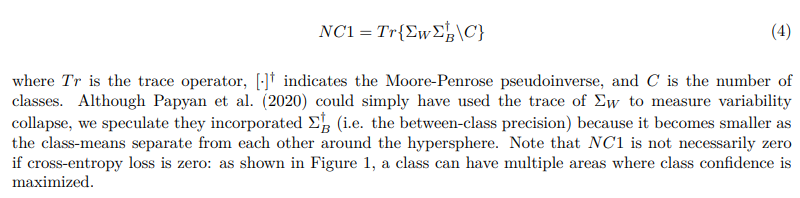
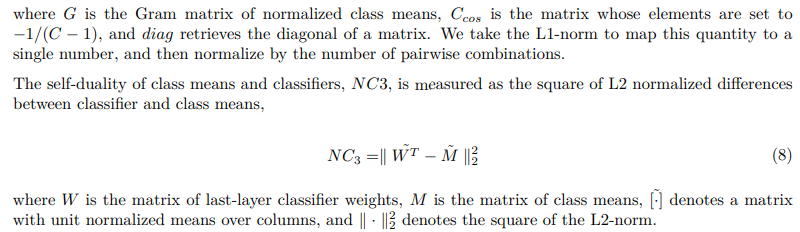
\ Papyan et al. (2020) use seven different metrics (Eq. 3 to Eq. 8) to observe these properties. All are differentiable and used in the NC loss function for the experiment in Section 4, except for the NC4 metric (Eq. 9), which is not differentiable
\ The within-class variance, NC1, is measured by comparing the within-class variance to the between-class variance,
\
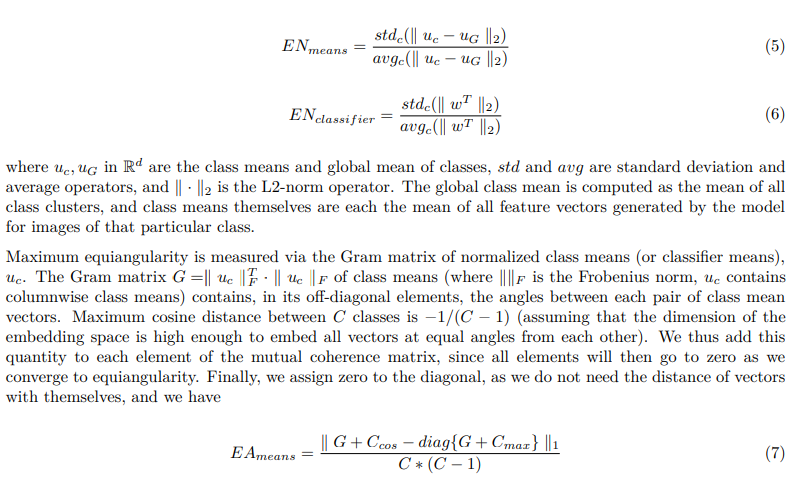
\ NC2 is indicated through four measurements. The equinormality of class means and classifier means is given by their coefficient of variation,
\
\
\ Finally, Nearest Class Center classification, NC4, is measured as the proportion of training set samples that are misclassified when a simple decision rule based on the distance of the feature space activations to the nearest class is used,
\
\

\ \ where z is the feature space vector for a given input.
\
:::info This paper is available on arxiv under CC BY-NC-ND 4.0 DEED license.
:::
\