and the distribution of digital products.
POPCAT’s Firm Support At $1 Reignites Rally Toward New Heights
POPCAT has reignited excitement in the market as buyers stepped in at the crucial $1 support level, halting the recent pullback and fueling hopes for a renewed rally. This strategic rebound underscores the token’s resilience and growing bullish momentum, setting the stage for a potential climb toward new heights.
With market sentiment shifting and technical indicators flashing promising signals, the question arises: Can POPCAT sustain this upward push and reach fresh milestones? Let’s dive into the technical indicators and market dynamics driving this pivotal moment.
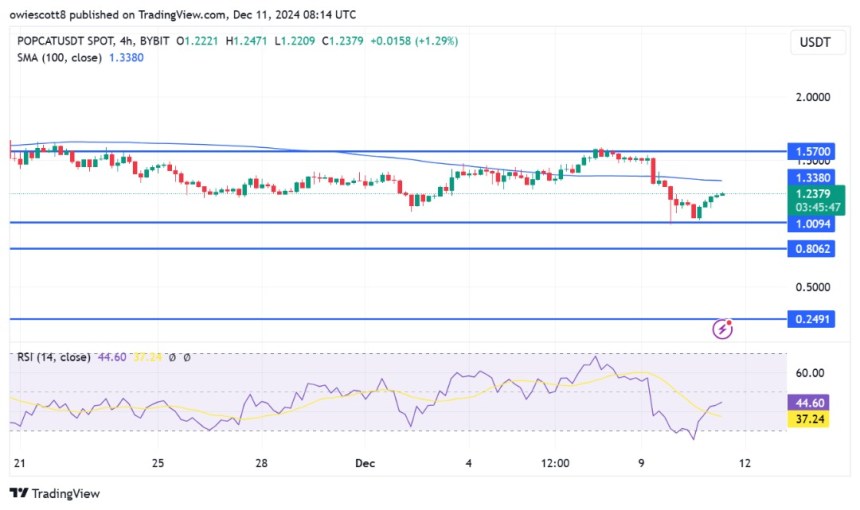
Technical Indicators Signal Strength: A Closer Look At POPCAT ChartThe 4-hour Relative Strength Index (RSI) shows a resurgence of upside strength as the RSI signal line has successfully climbed out of the oversold zone. This recovery suggests a shift in market sentiment, with buyers gradually regaining control.

Currently advancing toward the 50% mark, this movement reflects increasing optimism in the market. Should the RSI breach this midpoint, it could signal the strength of the upward momentum, setting the stage for POPCAT to rally toward key resistance levels and solidify its recovery trajectory.
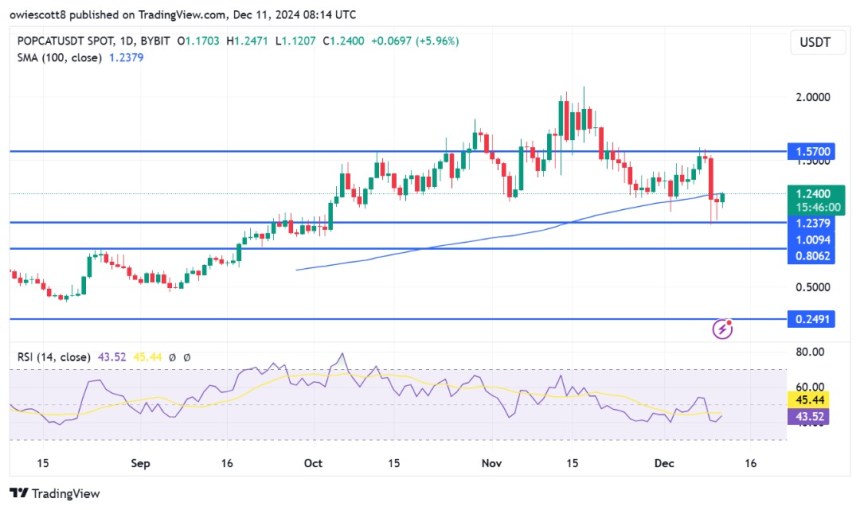
Also, a closer examination of the 1-day RSI shows a noticeable reversal, as the RSI signal line is now rising toward the 50% threshold after recently dropping to 40%. Significantly, this shift also implies that selling pressure may be subsiding, with buyers starting to regain control.

As the RSI indicator moves into neutral territory, the market could be poised for a trend change. If the RSI continues to climb, this could signal a strengthening bullish trend, offering POPCAT an opportunity to build momentum and challenge higher price levels.
Critical Resistance Levels In Focus For New HeightsAs the meme coin rebounds from key support levels, the focus now shifts to the critical resistance levels that could determine its next move. POPCAT at the $1 mark has proven to be a strong foundation, but the token must overcome key resistance zones for it to reach new heights
With technical indicators demonstrating increasing bullish momentum, POPCAT’s price is now approaching the 100-day Simple Moving Average (SMA). A move above this key indicator could spark a rally toward the $1.5 resistance level.
If POPCAT successfully breaks through this resistance, it could set the stage for an extended price surge, potentially propelling the token to even higher targets. Traders will be watching closely to see if these critical levels can be surpassed, paving the way for continued upside.
However, should POPCAT fail to break above the 100-day SMA, it may experience a decline, possibly heading back toward the $1 mark. A drop below this key support level could trigger a bearish continuation, with the price likely to drop to the $0.8 support level and other ranges.
- Home
- About Us
- Write For Us / Submit Content
- Advertising And Affiliates
- Feeds And Syndication
- Contact Us
- Login
- Privacy
All Rights Reserved. Copyright , Central Coast Communications, Inc.