and the distribution of digital products.
New Rehab Game System Shows Speed, Not Reach, Makes Rehab Games Fun
:::info Authors:
(1) Antoine Loriette, IRCAM, CNRS, Sorbonne Universite, Paris, France (antoine.loriette@gmail.com);
(2) Baptiste Caramiaux, Sorbonne Universite, CNRS, ISIR, Paris, France (caramiaux@isir.upmc.fr);
(3) Sebastian Stein, School of Computing Science, University of Glasgow, Glasgow, Scotland, United Kingdom (sebastian.stein@glasgow.ac.uk);
(4) John H. Williamson, School of Computing Science, University of Glasgow, Glasgow, Scotland, United Kingdom (johnh.williamson@glasgow.ac.uk).
:::
Table of Links- Abstract and 1 Introduction
- 2 Related Work and 2.1 Modifying Games for Rehabilitation
- 2.2 Input control performance measure and modelling and 2.3 Summary
- 3 Motivation from a rehabilitation context and 3.1 Observations and Brainstorming workshops
- 3.2 System description
- 3.3 Interaction parameterisation
- 3.4 Summary
- 4 Experimental Study
- 5 Modelling User Behaviour and 5.1 Behavioural Features
- 5.2 Gameplay Reference Model
- 5.3 Comparing NLL to NSCORE
- 5.4 Effect of design parameters on NLL
- 5.5 Sampling Period
- 6 Discussion and 6.1 Design workshop and tools for modelling
- 6.2 Interaction parameters adaptation
- 6.3 Modelling Gameplay
- 6.4 Limitations and Future work
- 7 Conclusion
- 8 Acknowledgements and References
In this section we investigate the impact of the identified parameters on non-disabled participants’ performance while using the game. In addition, we collect usage data from the same population in order to set a baseline performance that will be further used in computational modelling (Section 5).
4.1 ApparatusThe system described above was used for the experiment. The game was instrumented to expose internal state variables: the commands received; the score; and the number of the steps taken (in multiples of 10). These were logged along with their frame number and wall-clock timestamp. The time rate control was implemented by fixing the duration of a game frame, equivalent to manipulating the frame rate. The movements made by players, tracked by the position of the motion capture markers, were also recorded alongside game state variables.
4.2 TaskWe used the first level of Pac-Man as the task. In this game, the Pac-Man needs to consume all the pellets organised in a maze-like 2-dimensional rectangular map. The maze is populated with four ghosts (Blinky, Pinky, Inky and Clyde) which generally chase Pac-Man and kill him on contact. Four power-ups, placed at the four corners of the maze, grant invincibility to Pac-Man for a short period of time. The task was completed when all pellets were consumed or when all three lives had been used.
4.3 DesignWe use a factorial design to measure potential effects and interactions of the independent variables gamepad control position (SPREAD) and time rate (T RATE) on score (SCORE). SPREAD was evaluated with two levels (10cm and 40cm) and T RATE was evaluated with three levels of slowdown (Tr/3, 2Tr/3 and Tr). We opted for a within-subject design, as individual participants could be expected to have high variance. To counterbalance learning effects we used a balanced Latin square design. With independent variables SPREAD and T RATE evaluated with respectively two and three levels, we have six testing conditions.
\ To establish a reference gameplay experience, a pre-test and a post-test were included where participants used ordinary keyboard (KEYBOARD) input to control the Pac-Man game. This provides the reference data we later use to build a statistical model of normative gameplay. The pre-test and post-test involved playing two rounds of Pac-Man.
\ Each block was designed with three repetitions of the task, provided the third repetition (e.g. game) was started before the 8 minute mark in that block. When it was not the case, only one or two games would be played to completion, this to ensure the experiment would last one hour maximum. The design of the experiment comported thus: 12 participants × (2 SPREAD × 3 T RATE × 1 BLOCK × [1-3] Repetitions + 2 PRE-TEST + 2 POST-TEST) = [120-264] total trials.
4.4 ProcedureParticipants were welcomed and asked to provide written consent after reading an information sheet. Upon acceptance, they received £5 compensation. Participants were asked for demographic information and about their previous experience with Pac-Man. They were given a short explanation about the game mechanics. They were seated in front of a table, introduced to the tracking system, and equipped with a pair of headphones. An optical marker was attached with a stretchable band adaptable to different users’ hand physical features. They were asked to acquire each of the gamepad controls once with the optical tracking system. The origin of the gamepad was chosen as a full forearm extension from the table edge adjacent to their trunk and, laterally, equidistant from both table edges. It was indicated on the tabletop with a protruding marker that taped in place for each participants. The participants were encouraged to produce their best possible score. To produce incentive for performance, we added an extra prize of £15 awarded to the participant with the highest score in any of the testing conditions. At the end of each testing conditions (a combination of r and Tr), participants were offered a break. Participants were responsible for advancing through the experiment by starting a new game. They were informed when they were changing testing condition but were not told about the current value of SPREAD or T RATE. At the end of the experiment, participants were invited to provide qualitative feedback during a short debriefing discussion.
4.5 Participants12 participants served in the experiment: four females and eight males, one of whom was left-handed, with a mean age of 29 ± 7. The study was approved in advance by the University of X ethics committee. No participants presented with any relevant mental or physical disabilities.
4.6 Data ProcessingFor each testing conditions, we recorded the logs from the game of Pac-Man. From these, end-task SCORE was computed as the highest game score at trial completion. Pac-man scores are integers which increase as various onscreen items (pellets, powerpills, monsters) are consumed. Typical scores for one level of Pac-Man are in the range 3000-8000 points, with a theoretical maximum of 14800 points.
\ To produce a unit-less measure of score comparison between TRACKER and KEYBOARD conditions, the normalised value NSCORE was computed as the ratio between a raw score and the mean score from the keyboard reference games:
\

\ In other words, a mean value of 1 for NSCORE in the TRACKER condition means a level of performance equivalent to that produced with a keyboard.
4.7 Results4.7.1 Learning Effects and Score Distribution
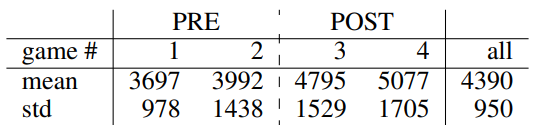
\ All participants reported having played Pac-Man, even if some reported that they could not remember when. We looked for learning effect between the reference PRE-TEST and POST-TEST conditions on KEYBOARD. An ANOVA on SCORE showed no significant difference between pre-test and post-test games. The mean score for all KEYBOARD games was 4390 (s.d. 950), see Table 1.
\
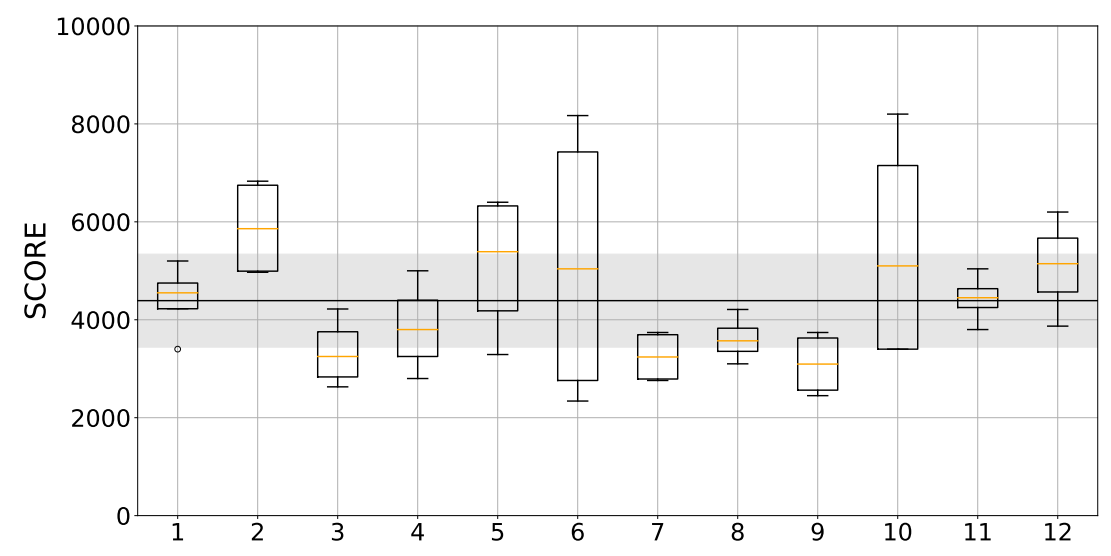
\ The distribution of SCORE across participants was diverse (Figure 3). Some participants, such as 1, 8 or 11, produced scores with a very low variance while others, such as 6 and 10, had a much bigger range of scores.
\ 4.7.2 Effects on NSCORE
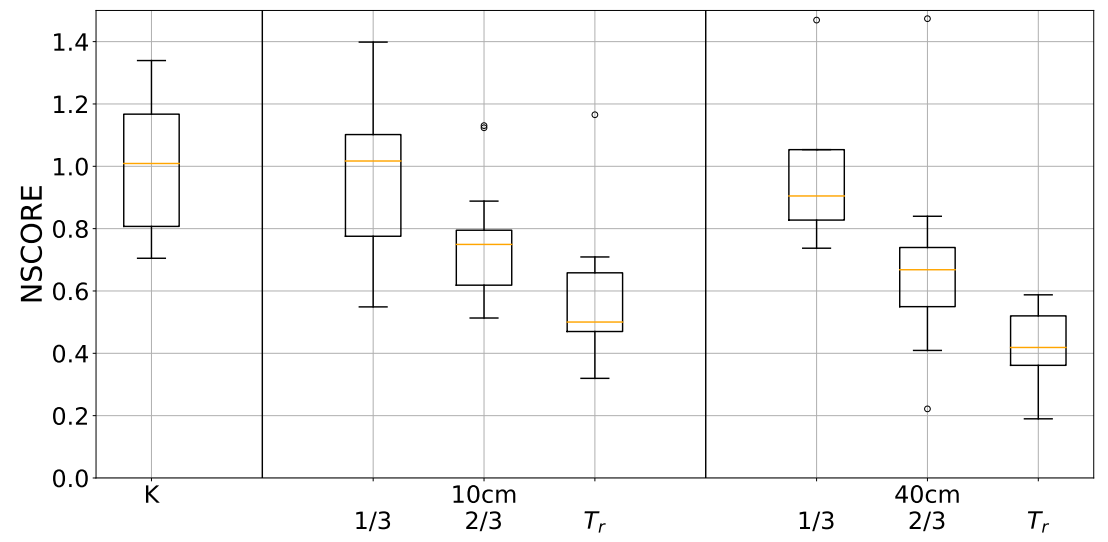
\ The results for NSCORE as function of T RATE and SPREAD are plotted in Figure 4. A repeated measure two-way ANOVA on NSCORE with SPREAD and T RATE as factors showed a significant main effect of T RATE (F1.47,16.15 = 22.11, ges = 0.41, p < 0.0001), no significant main effect of SPREAD and no interaction T RATE × SPREAD on NSCORE. NSCORE was negatively correlated with T RATE, decreasing from, on average, 96% of the reference keyboard SCORE at Tr/3 to 57% at Tr. We ran pairwise comparisons (adjusted with Holm-Bonferroni) on SCORE between all levels with the inclusion of KEYBOARD. It showed no differences of the NSCORE means between KEYBOARD and the condition where T RATE equals to Tr/3.
\ Supporting the lack of significant effect of SPREAD on NSCORE, we found no differences between any SPREAD values for the same T RATE. We also found no differences between levels (Tr, 10cm), (2Tr/3, 10cm) and (2Tr/3, 40cm). In other words, participants performed as well using tracker as with a keyboard, measured by NSCORE, provided T_RATE was reduced accordingly. The range of T RATE values that produced a score equivalent to a keyboard score is however unknown, but most likely centred around a value of T RATE close to Tr/3. This result validates T RATE as a suitable parameter to balance task difficulty as induced by SPREAD with game performance as measured by NSCORE. For each value of SPREAD there exists a value for T RATE such that NSCORE under this condition is statistically indistinguishable from reference gameplay.
\
\
This experimental study explored the impact of input modality and design parameters r and Tr on game scores. We showed that for low speed the scores are not affected by the change of input device. As pointed out in the preliminary testing, the interaction with our system is more difficult than with the reference input device. This result shows that it is possible to counteract this effect, as measured by the game score, by reducing the time rate parameter Tr. In addition, we found that the spread does not affect the game score.
\ With the objective of adapting the interaction such as ensuring a similar score than the one obtained using the baseline gameplay (reference input device and original speed), a metric must be defined to assess the performance between a given design and the reference one. Using the score as measured in this study is problematic. Since score is stochastic (people never play with the same exact performance twice), its reliable measurement requires a number of samples that increases with its variance. In addition, the value for score is sparse and delayed; available only once at the end of a game. Jointly, these factors limit the usability of score as a reliable, low-latency predictor of game performance due to its significant variation, high inter-subject variability and high latency.
\ In the next section we present a behavioural model and associated predictor for performance that is shown to be a good proxy for game score, to have lower variance than score and that can be computed with lower latency.
\
:::info This paper is available on arxiv under CC BY 4.0 DEED license.
:::
\