and the distribution of digital products.
Log-normal Work Function Distribution Vs. Gaussian Work Function Distribution
:::info Authors:
(1) Nandan Pakhira, Department of Physics, Kazi Nazrul University, Asansol, West Bengal 713340, India;
(2) Rajib Mahato, Department of Physics, Kazi Nazrul University, Asansol, West Bengal 713340, India and Central Electronics Engineering Research Institute, Pilani, Rajasthan 333031, India.
:::
Table of LinksIII. Work Function Distribution
IV. Results
A. Gaussian work function distribution
B. Log-normal work function distribution
V. Conclusion, Acknowledgements, and References
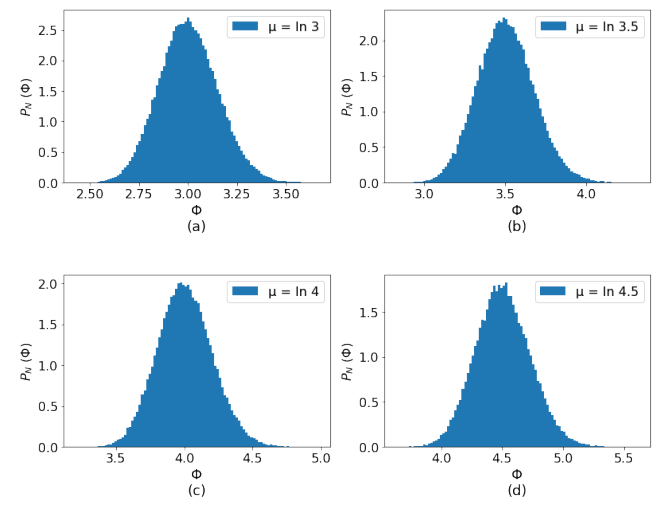
B. Log-normal work function distributionNext we consider log-normal distribution for the work function. In Fig. 8 we show the histogram plot of the work function, sampled over log-normal distribution for four choice of median work function M ≡ e µ = 3.0, 3.5, 4.0 and 4.5 eV with σ = 0.05. From this plot we can see that our choice of random variables for Φ are well sampled over the log-normal distribution.
\
\
\
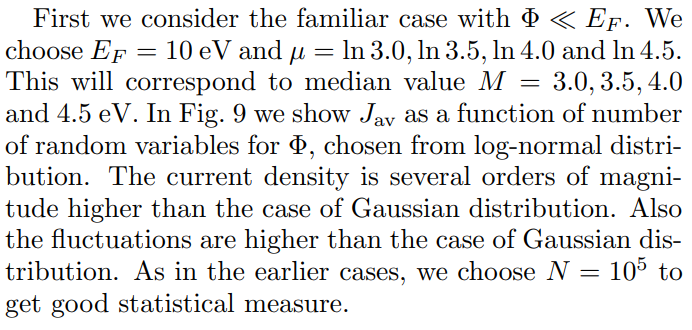
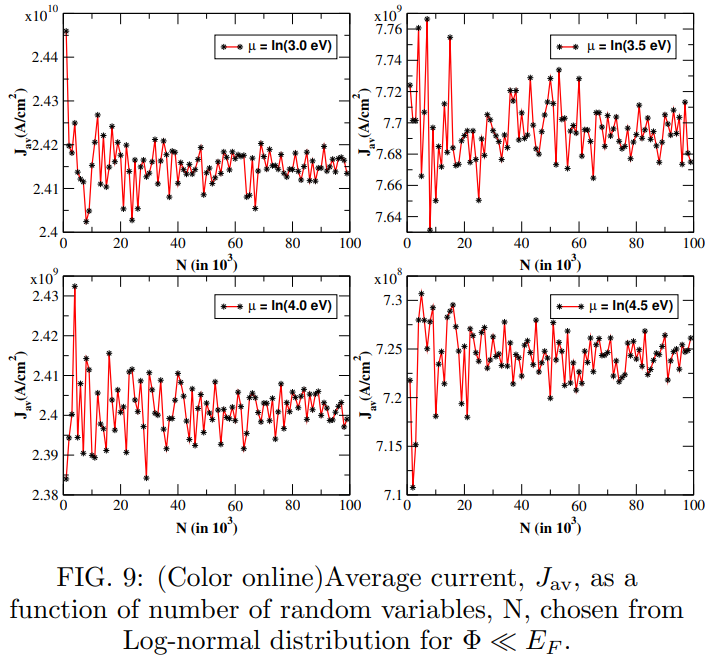
\ 1. Case with Φ ≪ EF
\
\
\
\

\
\
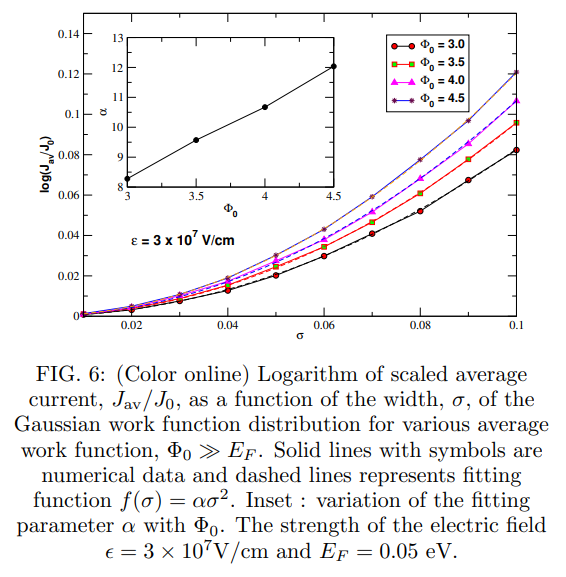
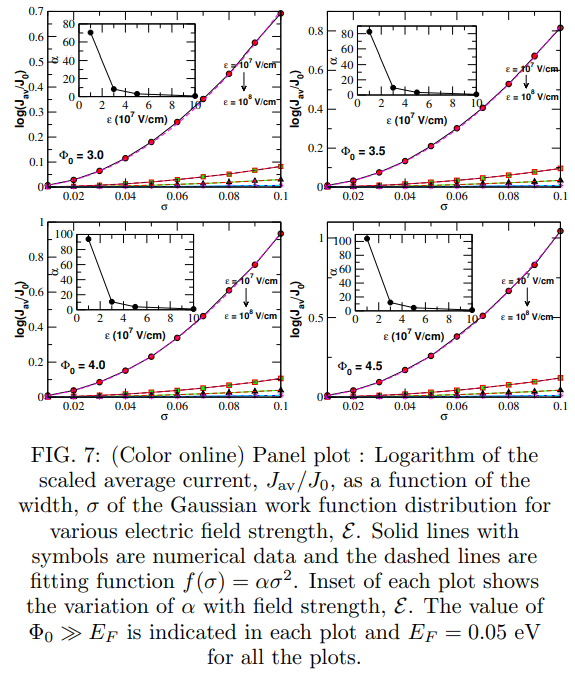
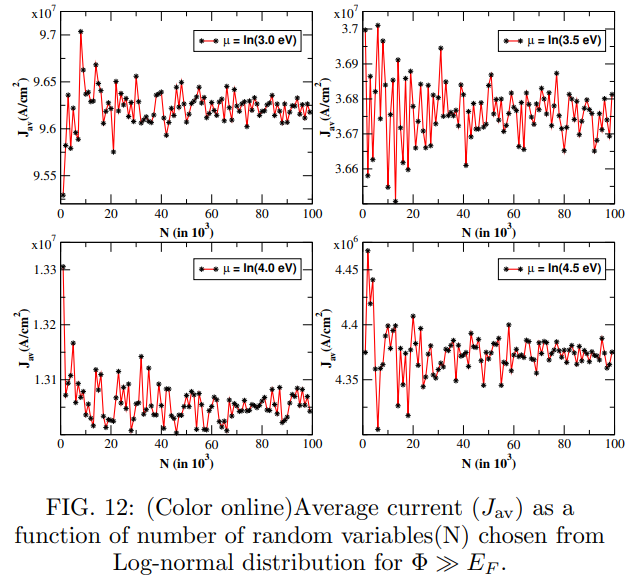
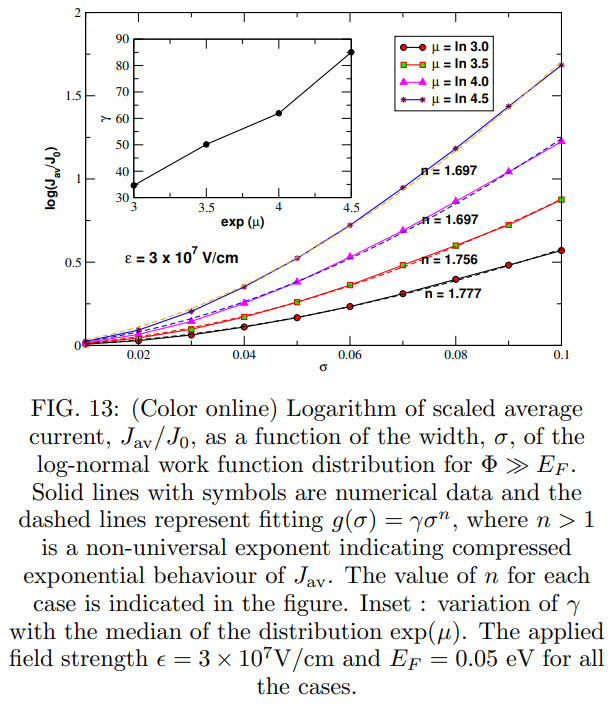
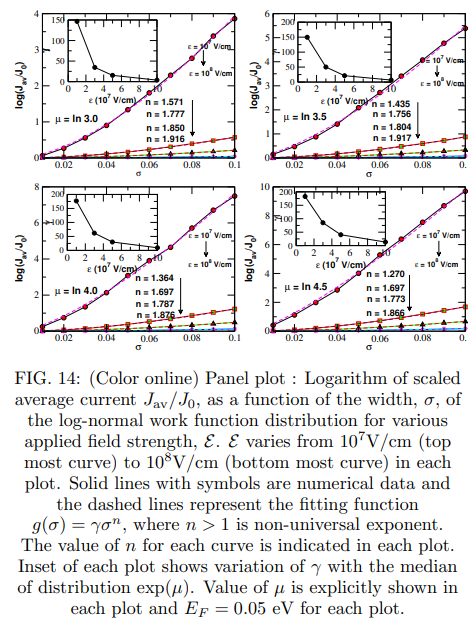
\ 2. Case with Φ ≫ EF
\
\
\
\
\
\
V. CONCLUSIONS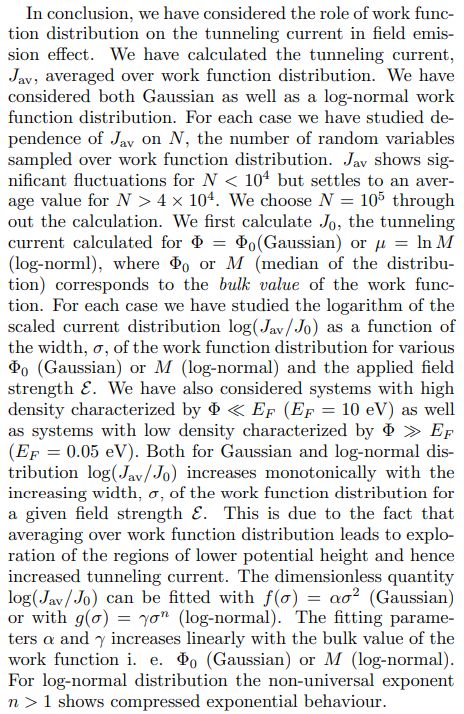
\
AcknowledgementsWe would like to thank Nei Lopes, Arghya Taraphder for many valuable discussions. One of us (N. P) would like to thank IIT, Kharagpur for local hospitality where part of the work was done. One of us (R. M) would like to thank Cetral Electronics Engineering Research Institute, Pilani for providing local hospitality and research support where part of the work was done.
1 R. H. Fowler and L. Nordheim, Proc. Roy. Soc. London A, 119, 173 (1928).
\ 2 E. L. Murphy and R. H. Good, Phys. Rev., 102, 1464 (1956).
\ 3 T. C. Choy, A. H. Harker and A. M. Stoneham, J. Phys. Cond. Matt., 17, 1505 (2005).
\ 4 P. H. Cutler, J. He, J. Miller, N. M. Miskovsky, B. Weiss and T. E. Sullivan, Progress in Surface Science, 42,169185 (1993).
\ 5 R. G. Forbes, K. L. Jensen, Ultramicroscopy, 89, 1722 (2001).
\ 6 C. J. Edgcombbe, Phys. Rev. B, 72, 045420 (2005).
\ 7 K. L. Jensen and M. Cahay, Appl. Phys. Lett., 88, 154105 (2006).
\ 8 A. Fischer, M. S. Mousa, and R. G. Forbes, J. Vac. Sci. Technol. B, 31, 032201 (2013).
\ 9 R. G. Forbes, A. Fischer, and M. S. Mousa, J. Vac. Sci. Technol. B,31, 02B103 (2013).
\ 10 A. Kyritsakis and J. P. Xanthakis, Proc. R. Soc. A, 471, 20140811 (2015)
\ 11 J. T. Holgate and M. Coppins, Phys. Rev. Appl., 7(4), 044019 (2017).
\ 12 XLiana Gamez, Maxwell Terban, Simon Billinge and Maria Martinez-Inesta, 50, 741 (2017).
\ 13 Nei Lopes and A. V. Andrade-Neto, arXiv:1408.3663v3
\ 14 Nei Lopes and A. V. Andrade-Neto, Phys. Lett. A, 384, 126399 (2020).
\ 15 D. Biswas and R. Ramachandran, Phys. Plasmas 24, 073107 (2017).
\ 16 A. Haug, Theoretical Solid State Physics, Volume 1, (Pergamon Press, Oxford, 1975.)
\ 17 R. G. Forbes, Appl. Phys. Lett. 89, 113122 (2006).
\ 18 R. G. Forbes and J. H. B. Deane, J. Vac. Sci. Technol. B, 28, C2A33 (2010).
\ 19 W. W. Dolan, Phys. Rev. 91, 510 (1953).
\ 20 I. S. Gradshteyn and I. M. Ryzhik, Tables of Integrals, Series and Products. Academic, New York (1965).
\
:::info This paper is available on arxiv under CC BY 4.0 DEED license.
:::
\