and the distribution of digital products.
How We Measured Cable News Slant: Researching Media Bias
Abstract and 1 Introduction 2. Data
3. Measuring Media Slant and 3.1. Text pre-processing and featurization
3.2. Classifying transcripts by TV source
3.3. Text similarity between newspapers and TV stations and 3.4. Topic model
4. Econometric Framework
4.1. Instrumental variables specification
4.2. Instrument first stage and validity
5. Results
6. Mechanisms and Heterogeneity
6.1. Local vs. national or international news content
6.2. Cable news media slant polarizes local newspapers
\ Online Appendices
A. Data Appendix
A.2. Alternative county matching of newspapers and A.3. Filtering of the article snippets
A.4. Included prime-time TV shows and A.5. Summary statistics
B. Methods Appendix, B.1. Text pre-processing and B.2. Bigrams most predictive for FNC or CNN/MSNBC
B.3. Human validation of NLP model
B.6. Topics from the newspaper-based LDA model
C. Results Appendix
C.1. First stage results and C.2. Instrument exogeneity
C.3. Placebo: Content similarity in 1995/96
C.8. Robustness: Historical circulation weights and C.9. Robustness: Relative circulation weights
C.12. Mechanisms: Language features and topics
C.13. Mechanisms: Descriptive Evidence on Demand Side
C.14. Mechanisms: Slant contagion and polarization
B. Methods AppendixHere, we present additional material related to the measurement of cable news slant.
B.1. Text pre-processingWe preprocess all texts (i.e., TV channel transcripts and newspaper articles). We convert them to lowercase and remove non-meaningful stopwords (like and or or ), all nonletter characters, and extra white spaces. Second, for each word, we perform stemming (employing the Porter stemming algorithm). Finally, we form bigrams (phrases of two words).
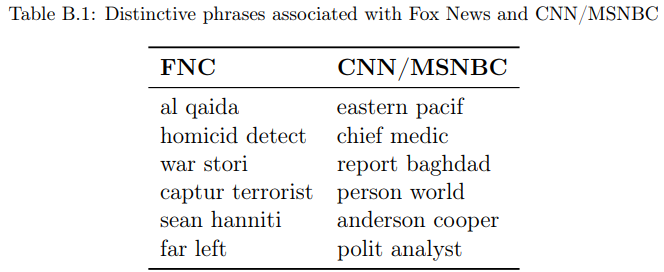
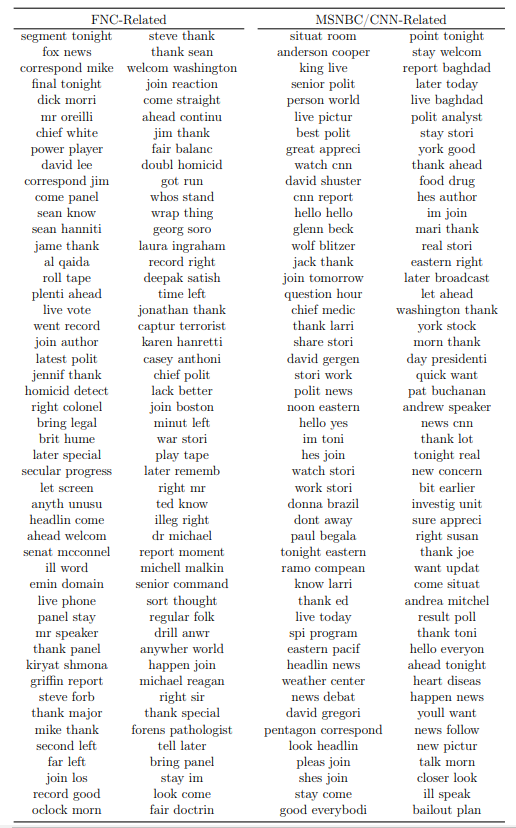
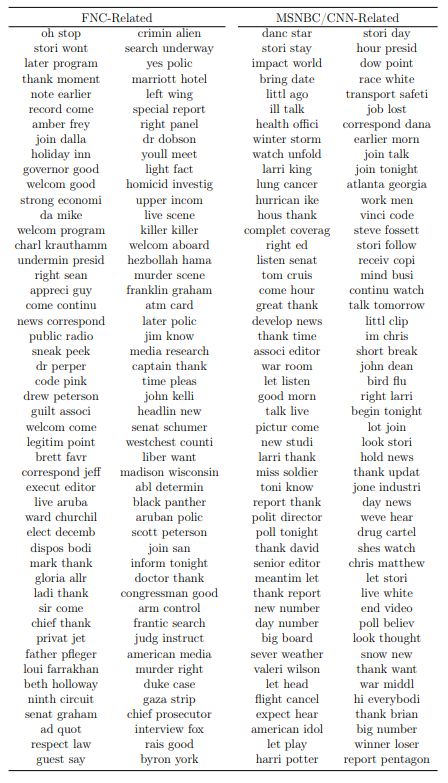
B.2. Bigrams most predictive for FNC or CNN/MSNBCTable B.1 shows some selected bigram examples with positive (predictive for FNC transcripts) or negative (predictive for CNN/MSNBC) values of ψˆ b. Table B.2 provides a more comprehensive list – the 200 bigrams most predictive for a transcript being from FNC or CNN/MSNBC, respectively. That is, the list is ordered such that the FNCrelated bigrams are the 200 bigrams with the largest absolute coefficients in the logistic regression from Section 3). Conversely, CNN/MSNBC-related ones are the 200 bigrams with the most negative coefficients.
\
\
\
\
:::info This paper is available on arxiv under CC 4.0 license.
:::
:::info Authors:
(1) Philine Widmer, ETH Zürich and [email protected];
(2) Sergio Galletta, ETH Zürich and [email protected];
(3) Elliott Ash, ETH Zürich and [email protected].
:::
\