and the distribution of digital products.
Floki Inu Crypto Breakout: Buying levels now?
Floki Inu (FLOKI), a meme-inspired cryptocurrency, continues to attract attention as it blends meme culture with tangible utilities such as NFT gaming and DeFi integration.
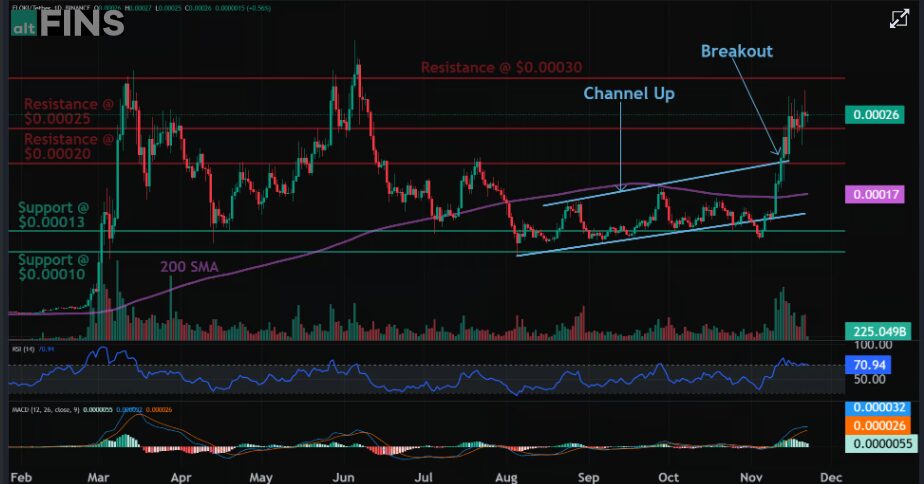
Price is trading in a Channel Up pattern. With emerging patterns, traders who believe the price is likely to remain within its channel can initiate trades when the price fluctuates within its channel trendlines. With complete patterns (i.e. a breakout) – initiate a trade when the price breaks through the channel’s trendlines, either on the upper or lower side. When this happens, the price can move rapidly in the direction of that breakout.
Here’s an analysis of the token’s latest performance, weekly trends, technical indicators, and ecosystem updates.
For on-demand analysis of any cryptocurrency, join our Telegram channel.
FLOKI Inu Price Analysis- Latest Price: $0.0002476
- Market Cap: $2.4 billion, ranking it #56 in the cryptocurrency market.
- 24h Trading Volume: $856.3 million
- 24h Price Range: $0.0002458 – $0.0002642
- Circulating Supply: 9.69 trillion FLOKI
- Total Supply: 10 trillion FLOKI
 Img src- Altfins
After getting rejected 3x at 200-day moving average, price finally broke through that resistance, which signaled resumption of Uptrend. Price has also broken out of Channel Up pattern and could revisit $0.30.
Buy Now Weekly Price Analysis- FLOKI’s price increased by 14.1%.
- Trend: Short-term trend is Strong Up, Medium-term trend is Strong Up, Long-term trend is Up.
- Momentum is Bullish but inflecting. MACD Line is still above MACD Signal Line but momentum may have peaked since MACD Histogram bars are declining, which suggests that momentum could be nearing a downswing. Price is neither overbought nor oversold currently.
- Support and Resistance: Nearest Support Zone is $0.00013, then $0.0001. Nearest Resistance Zone is $0.00025, then $0.0003.
- All-Time High: $0.000345 (June 2024)
- All-Time Low: $0.00000008428 (July 2021).
- 200 EMA: FLOKI trades above this level, signaling a bullish long-term trend.
- Volume Surge: Trading volume rose by 17% in the last 24 hours, highlighting increased market activity.
- Pattern Formation: Analysts point to a descending triangle pattern, with potential for a 30% upward breakout if the token breaches resistance at $0.000275.
- Coinbase Listing: Coinbase listing move is expected to boost liquidity and visibility for FLOKI. Past Coinbase listings have typically led to price surges.
- Ecosystem Expansion: FLOKI’s flagship NFT-based play-to-earn game, Valhalla, continues to gain traction. Inspired by games like Pokémon, it incorporates features such as asset trading and DeFi elements.
- Investor Sentiment: Despite a brief dip after the listing announcement, on-chain data shows rising whale activity.
For on-demand analysis of any cryptocurrency, join our Telegram channel.
- Home
- About Us
- Write For Us / Submit Content
- Advertising And Affiliates
- Feeds And Syndication
- Contact Us
- Login
- Privacy
All Rights Reserved. Copyright , Central Coast Communications, Inc.