and the distribution of digital products.
DM Television
Dogecoin Poised For $0.1491 Breakout As RSI Reveals Bullish Potential
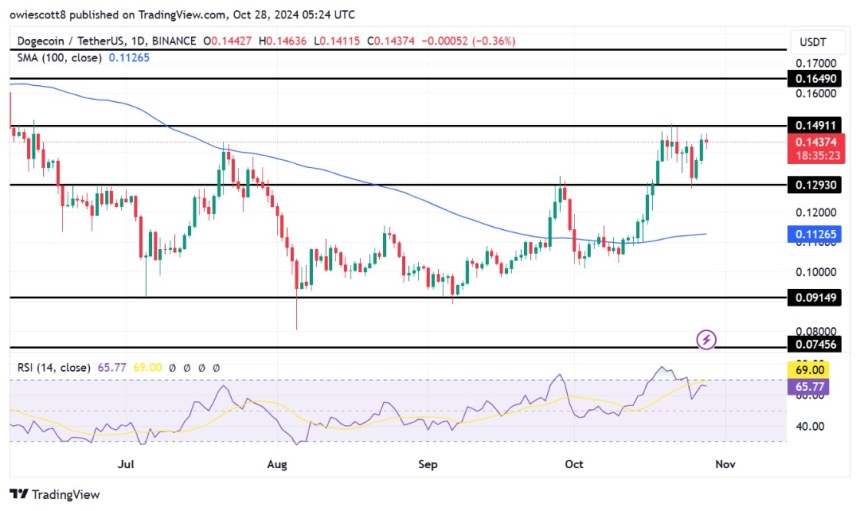
Dogecoin is showing strong signs of a potential breakout, with technical indicators aligning for a possible move toward the $0.1491 mark. The Relative Strength Index (RSI) has shifted into bullish territory, signaling growing momentum and showing that further gains could be on the horizon. This uptick in RSI suggests that buyer confidence is strengthening, setting Dogecoin up for a significant upward push.
This analysis aims to explore Dogecoin’s bullish potential as it approaches a key resistance level at $0.1491. It will provide insights into the increasing buying interest and the possibility of an upward breakout, examining the recent shift in the RSI and other technical indicators.
RSI Signals Growing Bullish Sentiment For DogecoinFollowing the recent recovery at $0.1293, DOGE’s price on the 4-hour chart has continued to gain pressure, approaching $0.1491 while aiming to break past it. DOGE is also trading above the 100-day Simple Moving Average (SMA), suggesting a positive upward trend that could lead to a possible breakout.

An analysis of the 4-hour Relative Strength Index (RSI) indicates potential for further upward movement, with the RSI rebounding to the 62% level after a previous dip to 34%. As the RSI continues to rise, traders are increasingly optimistic about the asset’s future performance. If this upside momentum persists, it could pave the way for a significant price increase, possibly challenging key resistance levels.
Also, on the daily chart, Dogecoin has shown strong upside movement, reflected in multiple positive candlesticks following a successful rebound at $0.1293 as it continues to trade above the 100-day SMA. Trading above the 100-day SMA not only suggests that Dogecoin is in a bullish phase but also signifies that previous resistance levels may now serve as support, providing a safety net for future price movements.

Finally, on the 1-day chart, a detailed examination of the RSI formation indicates renewed upbeat strength for DOGE as the indicator‘s signal line has risen again to 64% after dropping to 57%, suggesting a sustained optimistic outlook.
Potential Upside Targets: What Lies Beyond $0.1491?As Dogecoin nears the $0.1491 resistance level, attention turns to potential upside targets in the event of a breakout. If DOGE successfully breaks through this key threshold, the next significant target could be approximately $0.1649, where historical resistance may come into play. Should the bullish momentum persist and overcome this level, DOGE could advance to test even higher price levels.
However, if the meme coin fails to sustain its upward strength, DOGE may retrace to the previous support level of $0.1293. When this level is breached, it could trigger additional declines, which could lead to a drop toward $0.0914 and other lower price ranges.
- Home
- About Us
- Write For Us / Submit Content
- Advertising And Affiliates
- Feeds And Syndication
- Contact Us
- Login
- Privacy
All Rights Reserved. Copyright , Central Coast Communications, Inc.