and the distribution of digital products.
Continual Learning in Reinforcement Learning Agents with Pre-trained, Testing, and Untrained Groups
\
:::tip This is Part 6 of a 11-part series based on the research paper “Reinforcement Learning In Agent-based Market Simulation: Unveiling Realistic Stylized Facts And Behavior”. Use the table of links below to navigate to the next part.
:::
Table of LinksPart 1: Abstract & Introduction
Part 4: Agents & Simulation Details
Part 8: Market and Agent Responsiveness to External Events
Part 9: Conclusion & References
Part 10: Additional Simulation Results
Part 11: Simulation Configuration
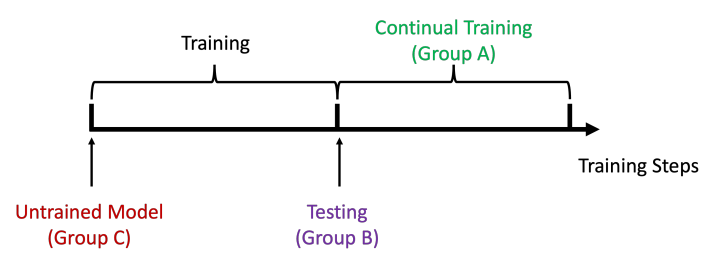
4.2 Continual LearningWe introduce three groups of agents in the simulation.
\ • Group A - Continual Training Group. The agents are pre-trained for 10 hours (36,000 steps), and training continues throughout the time of the simulation (for another 10 hours or 36,000 steps).
\ • Group B - Testing Group. The agents in this group are pre-trained for 10 hours and are used in the simulation without continuing training.
\ • Group C - Untrained Group. The third group serves as a control to understand the performance improvement obtained from training. The agents in this group load the random initialized parameters and run simulations without training.
\ For each random seed, we generate the parameters of the neural networks for the Group C agents directly. Each agent in Group C is trained for 10 hours and their parameters become the parameters used for each agent in Group B. The same parameters are used to initialize the agents in Group A. We are describing the process in detail as this is similar to a matched pairs testing design to minimize randomness for comparison purposes. This is important because we only repeat this process for 10 random seeds, that is 10 simulations. Each simulation takes 20 hours when running all of them in parallel and there are a lot of computational resources required for this study. This process is illustrated in Figure 2.
\

\ To compare the results produced by the RL agents we introduce an additional simulation model using 100 ZeroIntelligence (ZI) agents. This system is using the agent design in Farmer et al.’s work [9] and [22]. We analyze and compare stylized facts obtained using the RL agents system, the ZI agents system, and real data. Additionally, we investigate the evolution of Market-Maker (MM) agents’ inventory and PnL components across different groups. To assess responsiveness, we introduce a sequence of flash sale events, and we examine the price impact during the flash sale period. We also examine the MM’s change in behavior due to the flash sale, and we evaluate the adaptability of continual learning agents by comparing policies before and after training with the flash sale prices.
\
:::info Authors:
(1) Zhiyuan Yao, Stevens Institute of Technology, Hoboken, New Jersey, USA ([email protected]);
(2) Zheng Li, Stevens Institute of Technology, Hoboken, New Jersey, USA ([email protected]);
(3) Matthew Thomas, Stevens Institute of Technology, Hoboken, New Jersey, USA ([email protected]);
(4) Ionut Florescu, Stevens Institute of Technology, Hoboken, New Jersey, USA ([email protected]).
:::
:::info This paper is available on arxiv under CC BY-NC-SA 4.0 DEED license.
:::
\
- Home
- About Us
- Write For Us / Submit Content
- Advertising And Affiliates
- Feeds And Syndication
- Contact Us
- Login
- Privacy
All Rights Reserved. Copyright , Central Coast Communications, Inc.