and the distribution of digital products.
DM Television
Bitcoin Price Rejection At $99,000: Temporary Or End Of The Bull Rally?
Crypto analyst TradingShot recently discussed the Bitcoin price rejection at $99,000, providing insights into whether this was temporary or marked the end of the bull rally. His analysis indicated that this price rejection was temporary and that Bitcoin would still reach the $100,000 mark and possibly surpass it.
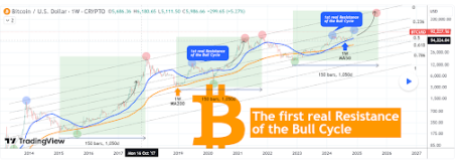
Bitcoin Price Rejection At $99,000 Likely TemporaryIn a TradingView post, TradingShot suggested that the Bitcoin price rejection at $99,000 is likely temporary. As to what could have caused this price rejection, the analyst noted that this could be due to the exhaustion of the post-election euphoria, as the market has fully priced into the fact that pro-crypto Donald Trump will be the next US president.
The analyst added that there is also the psychological weight of the $100,000 barrier, possibly because investors tend to take profit around such levels. From a technical analysis perspective, the analyst explained what could be causing this Bitcoin price rejection at the $99,000 level.

TradingShot highlighted a Fibonacci channel that has been going on through the last three cycles, including this one. He noted that this pattern started with a strong rebound that formed the December 2013 top for the Bitcoin price. That cycle top was on the 0.236 Fib level of the cycle, which is a level that has rejected rallies during subsequent cycles.
This Fib level rejected the Bitcoin price uptrend on November 22 and is acting as this ‘1st Real Resistance of the Bull Cycle.’ TradingShot stated this is the first major rejection level a bull cycle faces before the eventual market top. The analyst added that the high during the last two cycles has been on the 0.0 Fib level, which is technically at the top of this channel.
The analyst’s accompanying chart showed that the target at the top of this channel for the Bitcoin price is above $200,000. However, TradingShot mentioned that the red spot on the current cycle in late 2025 doesn’t represent a projection but is simply an illustration for comparison purposes.
When The Market Top Could HappenTradingShot also provided insights into when the Bitcoin price could top in this market cycle. The analyst noted that the past bull cycles have been roughly 150 weeks (1050 days). Therefore, a repeat of this pattern would mean that the Bitcoin top for this cycle could come around late September or early October.
The analyst stated that it is much better to try to time the market top and sell rather than put an actual price tag on it. TradingShot added that even though the Bitcoin price is on a technical rejection, the current rally started on the August 5 low, which is exactly in the 1-week 50-day moving average. As long as this trendline holds, the analyst remarked that the cyclical bullish wave should stay intact.
- Home
- About Us
- Write For Us / Submit Content
- Advertising And Affiliates
- Feeds And Syndication
- Contact Us
- Login
- Privacy
All Rights Reserved. Copyright , Central Coast Communications, Inc.