and the distribution of digital products.
Analyzing Interpolation Distances in Photocatalytic Materials
:::info (1) Sean M. Stafford, Department of Chemical Engineering and Materials Science, Michigan State University, East Lansing, MI, 48824, USA;
(2) Alexander Aduenko, Moscow Institute of Physics and Technology, Moscow, Russia;
(3) Marcus Djokic, Department of Chemical Engineering and Materials Science, Michigan State University, East Lansing, MI, 48824, USA;
(4) Yu-Hsiu Lin, Department of Chemical Engineering and Materials Science, Michigan State University, East Lansing, MI, 48824, USA;
(5) Jose L. Mendoza-Cortes, Department of Chemical Engineering and Materials Science, Michigan State University, East Lansing, MI, 48824, USA (Email: [email protected]).
:::
Table of LinksAbstract and Introduction
SALSA- (S)ubstitution, (A)pproximation, Evo(L)utionary (S)earch, and (A)B-Initio Calculations
SALSA Applied to Photocatalytic Water-splitting
Discussion
Methods
Conclusions, Data Availability Statement and References
Appendix: Supplementary Material
Appendix: Supplementary Material 1. Hybrid Compound Enumeration and Max Unit Cell Size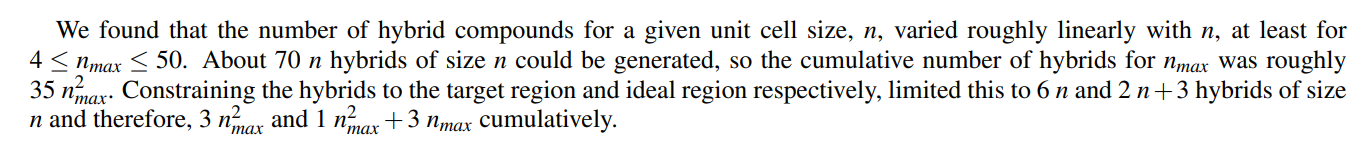
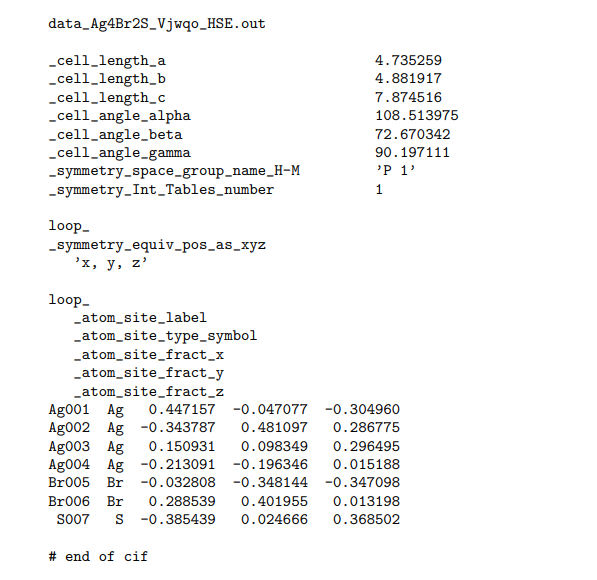
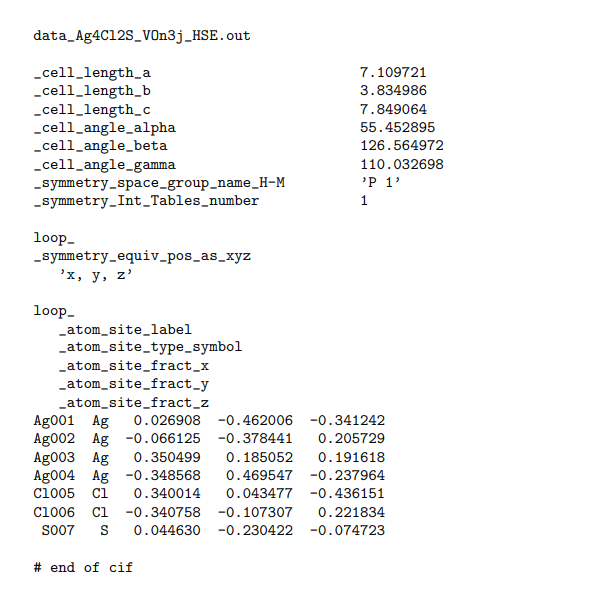
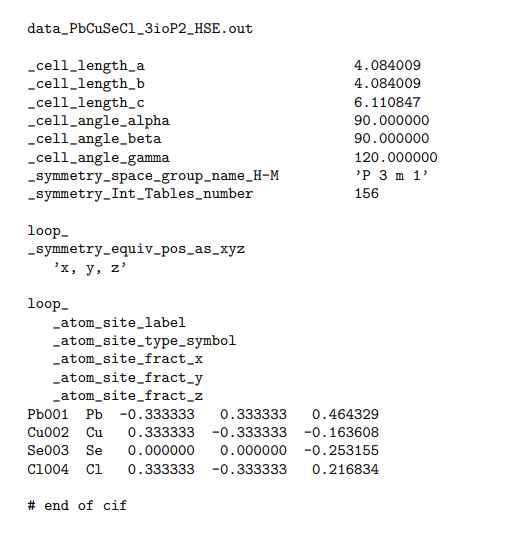
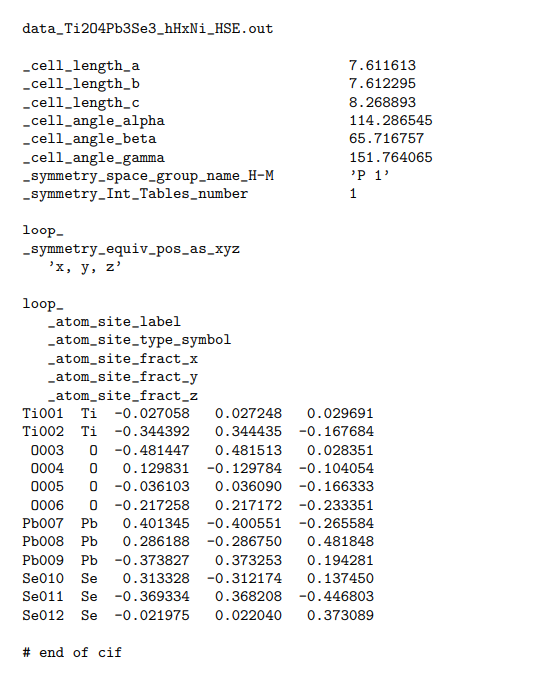
The four highest φox compounds with low-Eg and high-Eg, respectively are Ag2Te, Ag2Se, PbSe, and PbTe; and AgBr, TiO2, AgCl, and CuCl, ordered by their total interpolation distance. These eight account for nearly 70% of interpolation distance. SnO2, Cu2S, and PbS also make significant, albeit lesser contributions to interpolation.
3. Miscellaneous Additional Candidate Compound Data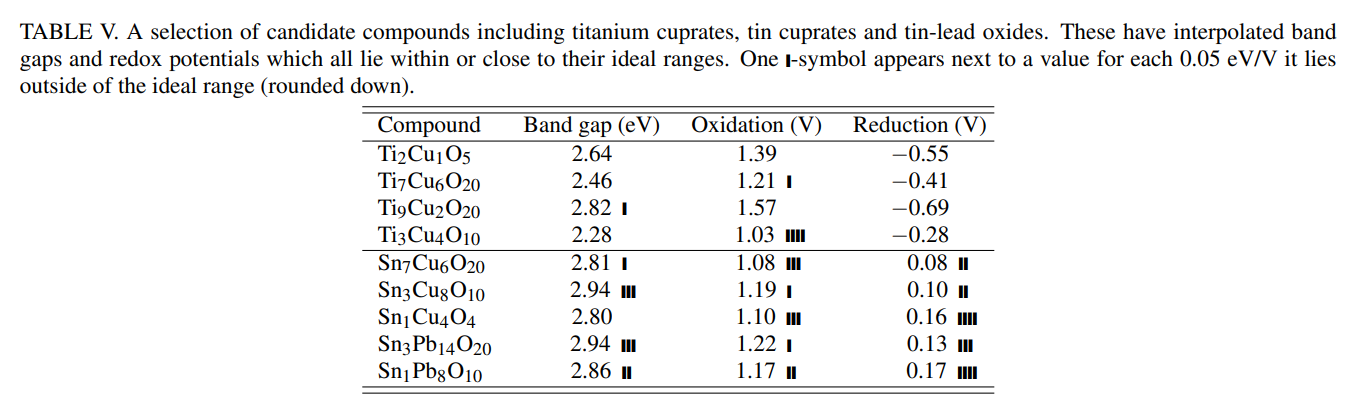
We estimated a price (USD/kg) for final structures in Table III by performing a weighted sum of component elements prices. The component elements prices were weighted by fractional composition of the final structures. These elemental prices were found in technical reports.27–31
5. Initial Compound Distribution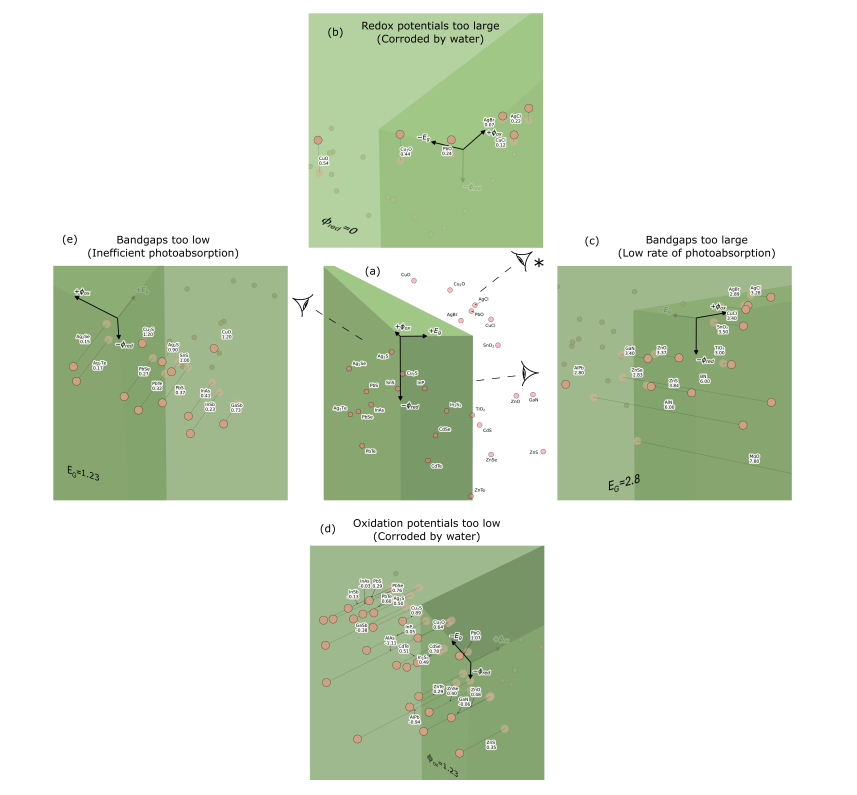
\
:::info This paper is available on arxiv under CC 4.0 license.
:::
\