and the distribution of digital products.
Internet Computer (ICP) Crypto Pullback trade: 10% Profit likely?
Internet Computer (ICP) has shown potential for growth in 2024, though it faces bearish conditions in the short term.
Price is Approaching Support, which is a level where it could pause or reverse its recent decline, at least temporarily. Support is often a level where price has bounced up in the past, or potentially prior Resistance level that was broken. Once price breaks below support, it can move lower to the next support level.
For on-demand analysis of any cryptocurrency, join our Telegram channel.
ICP Crypto Price Analysis- Market Cap: $3.75 billion
- 24h Trading Volume: $118.97 million
- Circulating Supply: 472.58 million ICP
- Total Supply: 524.70 million ICP
- 24h Price Range: $7.89 – $8.43
ICP’s price has declined by 3.89% over the last 24 hours.
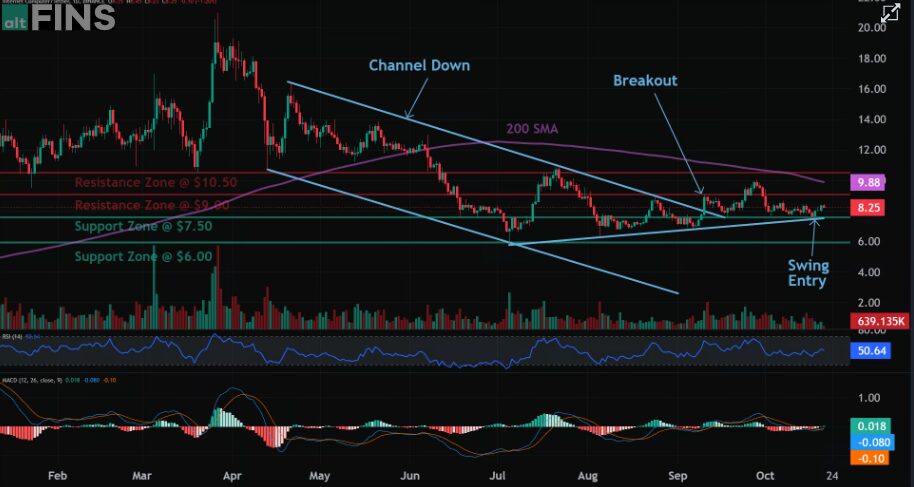
 Img src- Altfins
Breakout from Channel Down pattern could signal at least a temporary bullish trend reversal. We would be buyers on pullbacks to $8.00 support with +20% upside potential to $10.50 resistance. Stop Loss at $6.67.
Buy Now Weekly Price AnalysisICP experienced a 3.64% drop in the past week, maintaining a bearish trend. It had struggled to stay above the $8 mark, indicating some selling pressure after recent bullish attempts earlier in the year.
Trend: Short-term trend is Down, Medium-term trend is Strong Down, Long-term trend is Down.
Momentum is Bullish ( MACD Line crossed above MACD Signal Line) ABOVE days ago. Price is neither overbought nor oversold currently, based on RSI-14 levels (RSI > 30 and RSI < 70).
Support and Resistance: Nearest Support Zone is $6.00. Nearest Resistance Zone is $8.50, then $10.50.
Technical Indicators Analysis- RSI (Relative Strength Index): ICP’s RSI stands at 37.19.
- Moving Averages: The weekly chart reflects a mixed outlook. While the 50-day moving average remains above the 200-day moving average, ICP is trading below these levels, indicating potential neutrality or a consolidation phase.
- MACD (Moving Average Convergence Divergence): The MACD indicator shows a bearish trend in the 1-week timeframe.
- SEC Approves Options Trading for 11 Bitcoin ETFs
- EigenLayer’s X Account Hacked, Shares Fake AirDrop Link
For on-demand analysis of any cryptocurrency, join our Telegram channel.
- Home
- About Us
- Write For Us / Submit Content
- Advertising And Affiliates
- Feeds And Syndication
- Contact Us
- Login
- Privacy
All Rights Reserved. Copyright , Central Coast Communications, Inc.